Product Discovery Playbook
Find low-competition TikTok Shop products where buyer demand outpaces sellers
Ask Trenz Market Analyst to filter rising category demand against active seller count, top-shop share, and unit margin.
 Market Analyst
Trenz is an AI social commerce platform where the Market Analyst agent screens TikTok Shop and Shopify market demand against seller density, monopoly concentration, and unit economics to deliver go / no-go product briefs.
Updated 2026-11
Trusted by Leading Brands










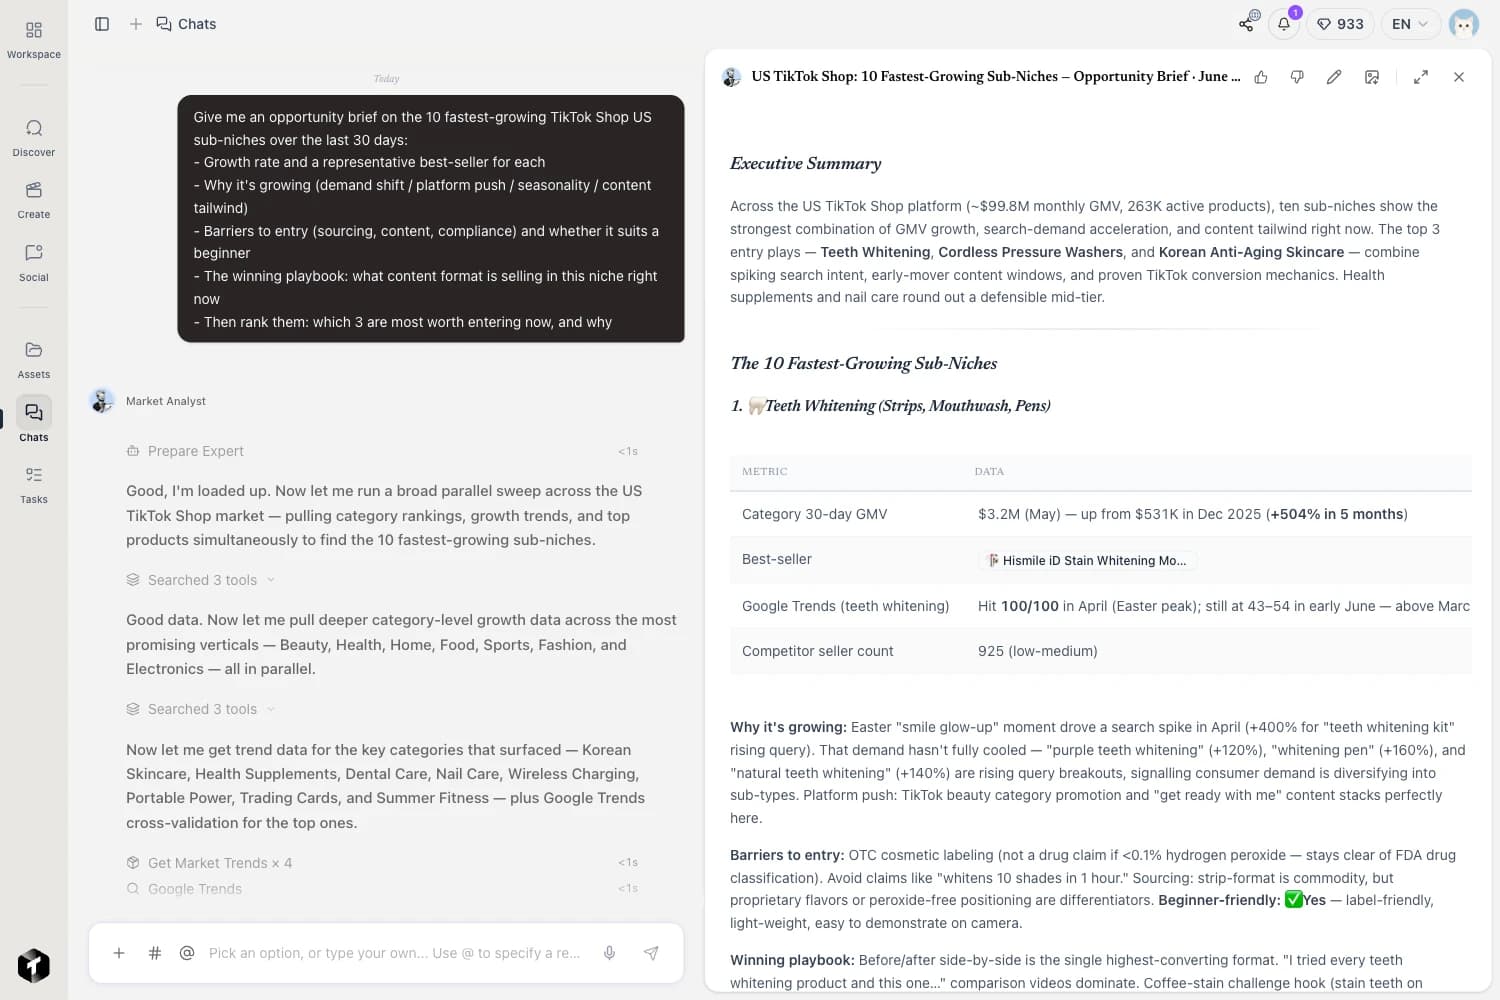
Market Analyst filters rising TikTok Shop demand against seller count and top-shop concentration to surface open niches.
Why this problem stalls growth
Top-GMV charts steer everyone into price wars
Chasing the #1 overall bestseller puts new sellers straight against entrenched factories with thousands of reviews and razor-thin margins.
Low seller count alone can mean dead demand
Filtering spreadsheets purely for few sellers often surfaces obscure items nobody searches for or buys on impulse.
Sourcing before checking net fees erodes profit
Ordering inventory without checking category AOV, creator commission norms, and TikTok Shop's 6% US referral fee traps capital.
What you get from this playbook
Diagnostic reports and concrete next actions ready to execute.
Demand-to-seller ratio shortlist
Surfaces SKUs and sub-niches with steady 7-to-30-day order growth and a manageable number of competing shops.
Top-shop concentration check
Flags whether one dominant brand controls 70% of niche GMV or whether orders spread across newer entrants.
Price band & margin room check
Evaluates prevailing retail prices against shipping weight, creator commissions, and TikTok Shop's 6% US referral fee.
Review pain & differentiation angle
Extracts recurring buyer complaints on existing listings so you know what bundle or spec improvement wins clicks.
Content saturation read
Checks whether demand comes from repeatable everyday demos or one unrepeatable celebrity clip.
Go / no-go sourcing verdict
Closes each candidate with a clear go / no-go call and test-order recommendation so you move without guesswork.
Step-by-step workflow
Pick Blue Ocean in Market Analyst
Select Market Analyst -> Blue Ocean and choose your target category, market, and preferred retail price range.
Agent screens demand vs competition
Market Analyst evaluates order velocity, active seller count, top-shop share, and margin room in minutes.
Review your go / no-go shortlist
Receive a ranked brief of low-competition product candidates with clear differentiation angles before contacting suppliers.
Crowded red-ocean chart toppers vs true blue-ocean niches
How Market Analyst separates open TikTok Shop entry windows from saturated traps.
| Evaluation signal | Crowded red-ocean trap | Low-competition blue-ocean target |
|---|---|---|
| Demand vs active sellers | High GMV split across hundreds of identical commodity listings | Rising weekly orders served by a small group of non-branded shops |
| Top-3 shop concentration | Top 3 flagship stores capture over 75% of category sales | Recent listings under 60 days old already winning steady daily orders |
| Price & margin room | Sub-$10 price war wiped out by shipping and affiliate payouts | $22–$55 AOV leaving healthy margin after 6% US referral fee and creator commission |
| Buyer review signal | 4.9-star incumbents with zero obvious product flaws | 3.9–4.3-star listings with fixable packaging, accessory, or sizing gaps |
Demand vs active sellers
- Crowded red-ocean trap
- High GMV split across hundreds of identical commodity listings
- Low-competition blue-ocean target
- Rising weekly orders served by a small group of non-branded shops
Top-3 shop concentration
- Crowded red-ocean trap
- Top 3 flagship stores capture over 75% of category sales
- Low-competition blue-ocean target
- Recent listings under 60 days old already winning steady daily orders
Price & margin room
- Crowded red-ocean trap
- Sub-$10 price war wiped out by shipping and affiliate payouts
- Low-competition blue-ocean target
- $22–$55 AOV leaving healthy margin after 6% US referral fee and creator commission
Buyer review signal
- Crowded red-ocean trap
- 4.9-star incumbents with zero obvious product flaws
- Low-competition blue-ocean target
- 3.9–4.3-star listings with fixable packaging, accessory, or sizing gaps
Scope & data coverage
- Lead AI Agent
- Market Analyst (Product Discovery · Blue Ocean)
- Commerce data
- TikTok Shop and Shopify market intelligence across major regions
- Fee benchmark
- Factors TikTok Shop 6% US referral fee plus category commission norms
- Turnaround & pricing
- Ranked shortlist brief in minutes; Free plan includes monthly credits
Frequently asked questions
What defines a low-competition product on TikTok Shop?
It combines rising 7-to-30-day order velocity, modest active seller counts, low top-shop monopoly share, and healthy net margin room.
Why shouldn't new sellers just copy the #1 TikTok Shop bestseller?
Top chart leaders usually defend volume with deep review moats, aggressive affiliate rates, and factory pricing that squeeze newcomers.
What price range works well for testing low-competition TikTok Shop items?
Impulse-friendly $20 to $55 items or multi-packs usually balance fast video conversion with room for shipping, creator commissions, and 6% US fees.
Does Trenz cover both TikTok Shop and Shopify product demand?
Yes. Market Analyst covers TikTok Shop and Shopify market data to spot cross-market winners, while store connection supports TikTok Shop.
Can I run blue-ocean product discovery on Trenz's Free plan?
Yes. Start Free with monthly credits to generate Market Analyst product shortlists before upgrading for heavier research.