
TL;DR
The Trenz methodology is the data collection, analysis, and scoring framework behind every output on the Trenz platform, from monthly TikTok Shop Rankings to daily Radar picks and Blue Ocean product signals. It works by indexing over 50 million TikTok products and 2 million creators, then applying estimation models and scoring algorithms to surface actionable market intelligence. Like all third-party TikTok Shop analytics tools, Trenz works with estimated data rather than verified transaction records, which makes understanding the methodology essential for interpreting its outputs correctly.
Explore the full Trenz platform to see how the methodology powers product discovery, content creation, and publishing in one place.
The Trenz methodology is Trenz’s proprietary framework for collecting, estimating, and analyzing TikTok Shop market data. It combines large-scale product indexing, GMV estimation, creator analytics, growth detection, and competitive scoring to identify trending products and market opportunities. Like every third-party TikTok Shop analytics platform, its numbers are estimates designed for market research rather than exact financial reporting.
What Is the Trenz Methodology?
The Trenz methodology is the analytical system that powers every data-driven feature on the Trenz platform. It determines how products get ranked, how daily market opportunities get selected, how “Blue Ocean” categories are identified, and how creator performance is scored.
Think of it as the engine behind the dashboard. When you see a product flagged as a Sales Spike or a category labeled Blue Ocean in Trenz, the methodology is what decided those classifications. It encompasses data collection from multiple sources, GMV estimation models, growth and momentum algorithms, creator concentration metrics, and the editorial curation layer that produces the daily Radar briefings.
The methodology drives three primary platform components:
Rankings: Monthly category-level leaderboards tracking GMV across US and UK TikTok Shop markets (approximately $408.7M in tracked GMV)
Radar: Five daily data-backed product and market opportunities delivered with supporting metrics
Market Analyst Agent: The AI-powered discovery engine that scans indexed data to find Blue Ocean products, seasonal bestsellers, and competitive gaps
Trenz claims Official TikTok Shop Partner status, which suggests a deeper data integration than pure public scraping. The Trenz methodology page provides the platform’s own documentation of this framework. What follows here is a plain-language explanation of how it works, what its outputs mean, and where its limitations sit.
How Trenz Collects TikTok Shop Data

Every third-party TikTok Shop analytics tool faces the same fundamental challenge: TikTok does not hand over granular sales data through its public API. The platform’s API returns engagement metrics (views, likes, comments, shares) as rounded approximations rather than exact numbers. Video-level GMV data simply is not available through any API endpoint.
This means tools like Trenz, Kalodata, and FastMoss must build their own data pipelines. The general approach across the industry involves collecting publicly available data from TikTok’s platform, then applying proprietary models to estimate the metrics that matter most to sellers.
Trenz collects data from multiple sources and analyzes patterns to detect opportunities and shifts in market behavior. The platform indexes over 50 million TikTok products and more than 2 million creators, creating a substantial dataset for its estimation models to work against. With claimed TikTok Shop Partner status, Trenz may have access to data channels beyond what’s publicly scrapable, though the exact scope of that access is not fully disclosed.
The key thing to understand: the Trenz methodology, like every competitor’s approach, produces estimates. Good estimates, refined daily, drawn from massive datasets. But estimates nonetheless. This distinction matters for how you use the data, which we’ll cover later.
How the Trenz Methodology Works (Step-by-Step)
Most sellers understand the outputs but not the workflow behind them.
A simplified version looks like this:
Step | What Happens | Output |
|---|---|---|
1 | Index TikTok products and creators | Raw dataset |
2 | Collect public engagement signals | Views, likes, comments |
3 | Estimate sales and GMV | Product revenue estimates |
4 | Detect growth patterns | Trending products |
5 | Score competition | Blue Ocean opportunities |
6 | Rank products | Monthly Rankings |
7 | Curate opportunities | Daily Radar |
This pipeline allows Trenz to transform billions of public engagement signals into practical market intelligence for TikTok Shop sellers.
Key Components of the Trenz Methodology
GMV Estimation
GMV (Gross Merchandise Value) is the headline metric in TikTok Shop analytics. It represents the total sales value before any deductions for fees, refunds, shipping, or product costs. Trenz tracks GMV at the category and product level through its TikTok Shop Rankings.
How do third-party tools estimate GMV when TikTok doesn’t share it directly? The standard industry approach, as documented by Marketplace Pulse, is to calculate it from units sold multiplied by average price. This gives a directional picture of demand, not a precise accounting figure.
The gap between reported GMV and actual bank deposits can range from 15-40% according to profit verification platforms. That gap comes from TikTok’s commission fees, payment processing fees, refunds, chargebacks, and promotional discounts.
For sellers using the Trenz methodology’s GMV figures, the right mental model is: this tells you where demand is concentrated and how fast categories are growing. It does not tell you how much profit anyone is making.
U.S. TikTok Shop GMV hit $15.1 billion in 2025, and the top 1% of tracked sellers (fewer than 900 operations) drive roughly 50% or more of total GMV. The Trenz methodology helps sellers identify which categories and products are capturing shares of that spend.
Estimated GMV vs Actual Revenue
Many beginners confuse these terms.
Metric | Includes | Doesn’t Include |
|---|---|---|
Estimated GMV | Gross product sales | Fees |
Net Revenue | Sales after TikTok deductions | Product costs |
Profit | Revenue minus all expenses | Taxes (sometimes) |
Example
Estimated GMV
$100,000
TikTok fees
−$8,000
Refunds
−$5,000
COGS
−$45,000
Advertising
−$15,000
Estimated Profit
$27,000
This example shows why GMV should be treated as a market-sizing metric rather than a profitability metric.
Blue Ocean Product Scoring
“Blue Ocean” is one of the most distinctive features of the Trenz methodology, and it’s a term that gets used loosely across TikTok Shop tools without proper context.
The concept originates from Blue Ocean Strategy, introduced by INSEAD professors W. Chan Kim and Renée Mauborgne in their 2005 book. The framework argues that the strongest competitive positions come not from fighting over existing market share (the “red ocean”) but from creating or entering markets where competition is sparse.
In TikTok Shop context, a Blue Ocean product is one that shows strong or rising demand combined with low seller saturation and limited creator coverage. The opposite, a “red ocean,” is a category where dozens of sellers and hundreds of creators are already fighting for the same buyers.
The Trenz methodology scores Blue Ocean opportunities using several signals:
Growth rate: Products or categories showing rapid demand increases (practitioners often look for growth rates exceeding 100%)
Seller concentration: How many sellers compete in the space
Creator concentration: Whether sales depend on a few creators or are distributed broadly
Sales velocity: The rate at which units move
Price dynamics: How price changes correlate with sales volume
Rating quality: Products maintaining ratings above 4.5 tend to signal sustainable demand
You can explore these signals through the product research tool, which applies the Trenz methodology’s Blue Ocean scoring to real-time market data.
What Metrics Does Trenz Analyze?
The Trenz methodology combines multiple signals rather than relying on a single metric.
Core metrics include:
Metric | Why It Matters |
|---|---|
Estimated GMV | Market demand |
Sales Velocity | Trend momentum |
Product Growth Rate | Market acceleration |
Creator Count | Influencer adoption |
Seller Count | Competition level |
Rating Score | Product quality |
Average Selling Price | Profit potential |
Content Volume | Marketing saturation |
Category Growth | Long-term opportunity |
Sales Spike Detection
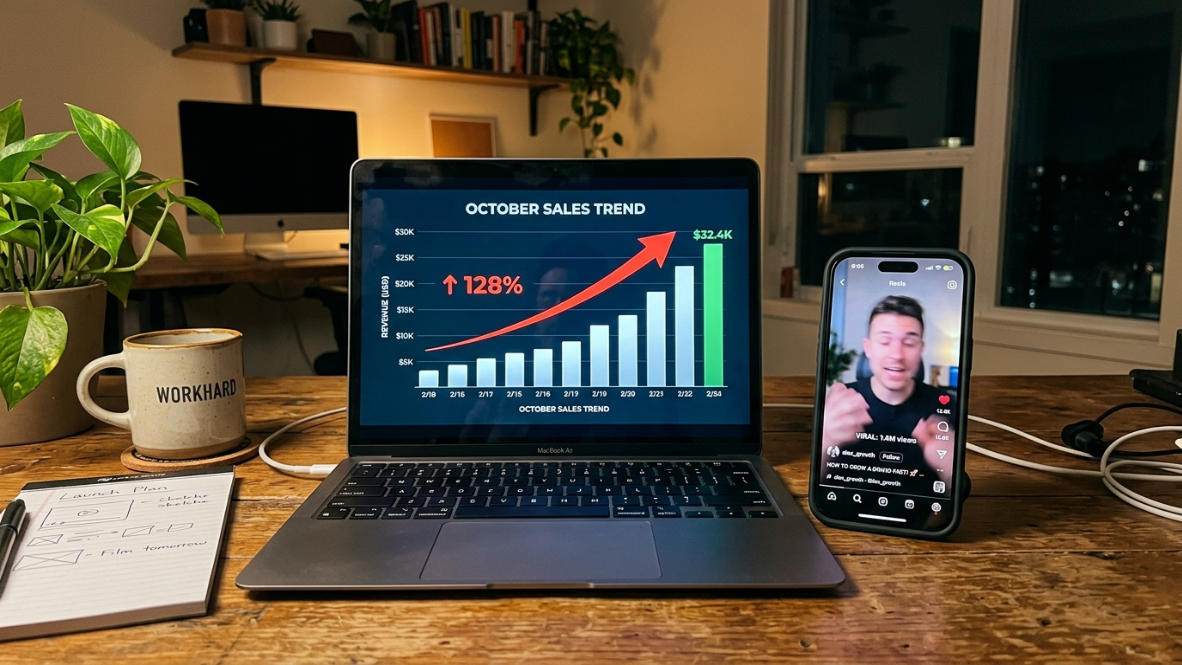
Speed matters enormously on TikTok Shop. Research suggests that 72% of trending products get copied by rivals within 48 hours. The Trenz methodology includes momentum algorithms designed to flag products experiencing sudden, significant increases in sales volume.
Sales Spike detection looks for inflection points: a product that sold 50 units daily for weeks and then jumps to 500 units in a single day. These spikes often correlate with a viral video, a major creator’s endorsement, or a seasonal demand shift.
The value for sellers is timing. If you spot a spike early through Trenz’s daily Radar, you have a narrow window to source the product, create content, and capture demand before the category becomes saturated.
Creator Concentration Analysis
This is one of the more underappreciated components of the Trenz methodology. Creator concentration measures how many creators drive a product’s sales versus how evenly those sales distribute across them.
Why does this matter? Consider two products with identical GMV:
Product A: 90% of sales come from one mega-creator’s videos
Product B: Sales spread across 50 mid-tier creators, none accounting for more than 5%
Product A is fragile. If that creator stops promoting it, moves to a competitor, or gets banned, sales collapse overnight. Product B has a resilient demand base. For sellers choosing which products to invest in, and for agencies evaluating which brands to take on, this distinction is critical.
Trenz surfaces creator concentration data through its creator analytics features, giving sellers a view into the structural health of a product’s sales engine, not just its topline numbers.
Why Creator Concentration Matters
High creator concentration can increase business risk.
Low Concentration | High Concentration |
|---|---|
Sales spread across many creators | Sales depend on one creator |
More stable demand | Higher volatility |
Easier long-term scaling | Greater platform risk |
This metric helps sellers evaluate whether demand is sustainable or driven by a single viral influencer.
Daily Radar Curation
The Radar is where the Trenz methodology becomes most visible to everyday users. Each day, the platform delivers five data-backed product or market opportunities for US and UK TikTok Shop markets.
The Radar blends quantitative signals (GMV estimates, growth rates, creator counts, seller density) with an editorial analysis layer. It’s not purely algorithmic; the picks represent a curated intersection of what the data shows and what the platform’s models flag as actionable.
Each Radar pick typically includes the product’s estimated GMV, growth trajectory, number of active creators, and a brief analysis of why the opportunity exists now. This format gives sellers a daily starting point for product validation rather than requiring them to run broad market scans themselves.
Monthly Rankings Algorithm
The TikTok Shop Rankings represent the Trenz methodology’s most comprehensive output. Published monthly, they rank products and categories by tracked GMV within specific regions (US, UK) and verticals (skincare, makeup, personal care, and others).
Rankings serve as a trailing indicator: they tell you what sold most over the past period. The methodology identifies “Top Movers,” products or categories that climbed significantly in rank, which can signal emerging trends before they peak.
For category-level strategy, the rankings help sellers understand market structure. Seeing that skincare dominates US TikTok Shop GMV while personal care appliances grow fastest in the UK tells you where to focus sourcing and content creation efforts.
When Should You Use Each Trenz Feature?
Goal | Best Feature |
|---|---|
Find winning products | Blue Ocean |
Monitor competitors | Rankings |
Spot trends early | Radar |
Evaluate creators | Creator Analytics |
Build content ideas | AI Market Analyst |
Track niches | Rankings + Radar |
How to Interpret Trenz Data Outputs
Understanding what each output type tells you, and what it doesn’t, is the most practical application of knowing the Trenz methodology.
Rankings = what’s selling most right now. This is a trailing indicator. By the time a product tops the monthly rankings, it’s established. Use rankings for market sizing and category selection, not for finding undiscovered gems.
Radar = what’s emerging. This is a leading indicator. Daily Radar picks surface opportunities in their early growth phase. Use these for product validation and testing.
Blue Ocean = where competition gaps exist. These signals identify categories where demand outpaces supply. Use them for sourcing decisions and niche entry strategy. For a deeper framework on product validation before committing inventory, see this guide on validating TikTok Shop products.
Creator metrics = who actually drives conversions. Not all creators with high view counts generate sales. The Trenz methodology separates engagement from conversion, helping sellers identify affiliate partners worth pursuing.
The critical thing to remember: estimated GMV is not profit. As one HubSpot Community poster described the pain, “I’ve been relying on an accountant to figure out my TikTok Shop profits, but honestly, it’s getting too expensive.” Market intelligence tools like Trenz tell you where demand exists. Calculating actual profit requires connecting your own store data, fees, ad spend, and refund rates.
Check Trenz pricing and plans to find the data depth and credit allocation that matches your selling stage.
Trenz Methodology vs. Competitor Approaches
The TikTok Shop analytics space has two distinct categories of tools, and understanding where the Trenz methodology fits clarifies what you should expect from it.
Market intelligence tools (Trenz, Kalodata, FastMoss) estimate competitor performance using aggregated public and partner data. They answer questions like “what’s trending?” and “where are the gaps?”
Profit verification tools (Dashboardly, HiveHQ) connect via official API to your own store for actual payout reconciliation. They answer “how much did I actually make?”
Neither category replaces the other. The Trenz methodology sits firmly in the market intelligence camp, but with a broader scope than most competitors.
Kalodata is the most transparent competitor about its estimation approach, publicly acknowledging that “certain details, like transaction amounts and ad spending, might have small variations from real-world numbers.” Practitioners on Reddit who have tested Kalodata against their own video data report that its numbers felt directionally accurate, though confirming precision is inherently difficult since TikTok doesn’t publish the ground truth.
FastMoss offers real-time updates but provides less documentation about its underlying methodology.
The key differentiator of the Trenz methodology is scope. Where competitors typically stop at the analytics layer, Trenz bundles methodology-driven intelligence with AI content creation and multi-platform publishing. The Market Analyst agent surfaces opportunities; the Creative Director agent helps you create content to capture them; the Social Manager agent distributes that content. For a detailed side-by-side breakdown, see how Trenz compares to Kalodata, FastMoss, and PipiAds.
The Attribution Blind Spot All Tools Face
There’s a structural limitation worth understanding that affects every tool in this space, not just Trenz.
TikTok Shop conversions happen in-app. Unlike web-based e-commerce where Meta Pixel, GA4, or third-party attribution tools can track the customer journey from ad click to purchase, TikTok Shop has none of these browser-based tracking mechanisms on the brand side. No pixel can see an in-app TikTok Shop conversion.
This means 45% of TikTok sellers can’t track which specific videos drive their sales. The Trenz methodology works around this limitation by correlating content performance data with aggregate sales patterns, but perfect video-to-sale attribution remains impossible for any third-party tool.
This is not a flaw in the Trenz methodology specifically. It’s a platform constraint that every seller and every analytics provider must work within. The honest acknowledgment of it is actually a sign of methodological maturity.
Who Should Use the Trenz Methodology?
The platform is most useful for:
TikTok Shop sellers
Amazon sellers expanding into TikTok
Dropshippers
Affiliate marketers
Creator agencies
Brand managers
Product researchers
Ecommerce consultants
Limitations to Understand
Being transparent about limitations builds more trust than pretending they don’t exist. Here’s what to keep in mind when using data produced by the Trenz methodology:
All third-party TikTok Shop data is estimated, not verified. No tool outside of TikTok itself has access to exact transaction records for competitors’ shops.
GMV shows demand, not profit. The gap between headline GMV and actual take-home can be 15-40%. Always layer in your own cost structure.
TikTok’s API returns rounded engagement numbers. View counts, likes, and shares are approximations. Small differences between tools are normal and expected.
Video-level GMV attribution isn’t available through any API. No tool can tell you exactly how much revenue a specific video generated for someone else’s shop.
Accuracy improves with scale and model updates. The Trenz methodology draws on 50M+ indexed products and 2M+ creators. Larger datasets generally produce better estimates, and models get refined continuously.
Only 12% of TikTok Shop sellers effectively use analytics to convert attention to revenue. Having the data is step one. Acting on it, through content creation, creator partnerships, and operational execution, is where results come from.
These limitations apply to every market intelligence tool in the space. The Trenz methodology’s value isn’t in providing perfect numbers. It’s in providing directionally reliable intelligence at a speed and scale that manual research can’t match.
Start exploring Trenz for free with 50 welcome credits, no credit card required.
Best Practices When Using Trenz Data
To get the most value:
Compare trends over time instead of focusing on one day’s data.
Validate opportunities before purchasing inventory.
Combine Trenz insights with your own store analytics.
Monitor competitor activity weekly.
Use multiple signals instead of relying only on GMV.
Recheck products after viral spikes to avoid entering saturated markets.
Trenz Methodology at a Glance
Component | Purpose |
|---|---|
Product Indexing | Collect marketplace data |
Creator Database | Track influencer activity |
GMV Estimation | Estimate sales volume |
Blue Ocean Score | Identify low competition |
Radar | Detect emerging products |
Rankings | Measure category leaders |
AI Market Analyst | Discover opportunities |
Frequently Asked Questions
How accurate is Trenz data?
The Trenz methodology produces directionally accurate estimates based on indexing over 50 million TikTok products and 2 million creators. Like all third-party TikTok Shop tools, its data reflects estimation models rather than verified transaction records. Use it as market intelligence for strategic decisions (product selection, category entry, creator evaluation) rather than as an accounting tool.
Does Trenz use official TikTok data?
Trenz claims Official TikTok Shop Partner status, which implies a deeper integration with TikTok’s data ecosystem than pure public scraping. The exact scope of partner data access is not publicly documented, but the platform’s feature set (including real-time shop data sync) suggests meaningful integration beyond what non-partner tools can access.
How often is Trenz data updated?
Rankings update monthly, Radar delivers fresh picks daily, and the underlying product and creator data refreshes continuously. The methodology’s models are refined on an ongoing basis as new data flows in.
What does Blue Ocean mean in Trenz?
Blue Ocean refers to product categories or niches showing strong demand with low competition, borrowing from the Blue Ocean Strategy framework by Kim and Mauborgne. In the Trenz methodology, Blue Ocean products score high on growth rate and demand signals while showing low seller saturation and limited creator concentration. They represent entry opportunities with less competitive friction. For more on finding these opportunities, see this guide on finding winning products.
How is the Trenz methodology different from Kalodata or FastMoss?
The core difference is scope. Kalodata and FastMoss focus primarily on analytics. The Trenz methodology feeds into an end-to-end workflow that includes market intelligence, AI-powered content creation, and multi-platform publishing. On the data side, Kalodata publicly acknowledges estimation variance and updates models daily. FastMoss offers real-time data but is less transparent about its approach. Trenz maintains a dedicated methodology page documenting its framework.
Can the Trenz methodology tell me my actual profit?
No. The Trenz methodology is a market intelligence framework. It estimates GMV, tracks growth patterns, scores competitive dynamics, and surfaces opportunities. Calculating actual profit requires connecting your own store’s data (fees, COGS, ad spend, refunds). Profit verification tools that reconcile against actual TikTok payouts serve that different purpose.
What markets does the Trenz methodology cover?
Rankings and Radar currently cover US and UK TikTok Shop markets. The product discovery and creator analytics features span the full indexed dataset of 50M+ products and 2M+ creators across TikTok’s global marketplace.
Is the Trenz methodology available through an API?
Yes. The Trenz Open Platform exposes the same underlying data through a unified API, covering TikTok products, shops, creators, videos, ads, and live commerce data. API access uses a credit-based pricing model at $0.15 per credit (PAYG) or $0.10 per credit (Enterprise). Learn more on the Trenz platform overview.
Author


