
TL;DR
A TikTok Shop product trends report tracks the metrics, categories, and product movements that shape what sells on TikTok’s commerce platform. There are three types: official TikTok reports, third-party analytics tools, and custom paid research. This guide defines every key term you’ll encounter in these reports, from GMV and sales velocity to creator concentration and blue ocean scores, grounded in current 2026 benchmarks and practical interpretation advice.
A TikTok Shop product trends report is a data report that identifies which products, categories, creators, and market trends are growing or declining on TikTok Shop. Most reports include GMV, sales velocity, product rankings, creator activity, conversion metrics, and category growth. Sellers use these reports to discover winning products, monitor competitors, reduce risk, and identify profitable opportunities before markets become saturated.
Report Type | Best For | Data Source | Best Use |
|---|---|---|---|
TikTok What’s Next | Consumer trends | TikTok | Brand strategy |
TikTok Creative Center | Ads | TikTok | Product research |
Seller Center | Your shop | First-party | Performance analysis |
Third-party Tools | Market research | Estimated data | Competitor research |
Custom Research | Enterprise | Multiple sources | Market planning |
What Is a TikTok Shop Product Trends Report?

A TikTok Shop product trends report is any structured analysis that tracks which products are gaining momentum, losing steam, or presenting new opportunities on TikTok’s commerce platform. With global GMV projected to hit $112.2 billion in 2026 (up from $66 billion in 2025), the market is too large and too fast-moving to navigate on instinct alone.
But “TikTok Shop product trends report” isn’t a single document. It’s actually three distinct things, and understanding the difference matters.
Official TikTok Reports are published by TikTok itself. The annual “What’s Next” report forecasts cultural and shopping trends. For 2026, the theme is “Irreplaceable Instinct,” predicting trend signals shaped by people and powered by AI. TikTok also publishes shopping-specific trend reports that break consumer behavior into categories like joy-seeking purchases, brand values alignment (“Brandship”), and mood-boosting micro-purchases (“Glimmers”). These reports are directional, not product-specific. They tell you where culture is heading, not which SKU to stock.
Third-party analytics reports come from tools like Kalodata, FastMoss, and TikTok’s own Creative Center. These are the data-heavy reports most sellers actually use day to day. They show estimated GMV by product, sales velocity, creator activity, ad performance metrics like CTR and CPA, and category rankings. Trenz’s product research tool falls into this category too, combining daily Radar insights with monthly category rankings across the US and UK.
Custom paid research reports are commissioned analyses from firms like AMZScout. These go deeper into niche opportunities and competitive dynamics, often combining TikTok Shop data with Amazon cross-references. They’re described by buyers as “more than just numbers,” offering comprehensive breakdowns of market dynamics and niche opportunities.
Why You Need One
Three numbers explain the urgency. First, the US seller base grew from roughly 4,450 shops in mid-2023 to over 475,000 by mid-2025, a 5,000% increase. Second, 72% of trending TikTok Shop products get copied by rivals within 48 hours. Third, the average viral product has just an 8 to 16 week commercial life.
Without a structured TikTok Shop product trends report, you’re making decisions on stale data in a market that punishes even 48-hour delays.
What Can You Learn From a TikTok Shop Product Trends Report?
A high-quality TikTok Shop product trends report helps answer practical business questions, including:
Which products are gaining momentum
Which categories are growing fastest
Which creators are driving the most sales
Whether a niche is becoming saturated
How pricing changes over time
Which products have the best profit potential
How competitors are advertising
Which products are likely nearing the end of their lifecycle
Rather than relying on intuition, sellers use trend reports to make inventory, pricing, advertising, and creator partnership decisions based on real marketplace data.
Market-Level Metrics: The Big Picture
These are the numbers that describe the overall size, growth, and shape of TikTok Shop as a marketplace. You’ll find them at the top of any comprehensive trends report.
GMV (Gross Merchandise Value)
The total monetary value of all transactions on TikTok Shop within a given period. GMV is the headline number in every TikTok Shop product trends report, but it can be misleading on its own. It doesn’t account for returns, refunds, platform fees, or creator commissions. When a report says TikTok Shop did $66 billion in GMV in 2025, that’s the gross transaction total before anyone takes a cut.
For the US specifically, eMarketer projects $23.4 billion in GMV for 2026. That figure represents the buying activity of approximately 53.2 million US TikTok buyers, about 45.5% of US TikTok users making at least one purchase.
YoY Growth Rate
Year-over-year growth, expressed as a percentage. TikTok Shop doubled its global GMV from $33.2 billion in 2024 to $66 billion in 2025. That’s roughly 99% YoY growth. This metric matters because it tells you whether the overall pie is expanding fast enough to absorb new sellers, or whether you’re fighting for fixed market share.
GMV by Category
The breakdown of total GMV across product categories. This is where a trends report gets actionable. Beauty and Personal Care dominates, accounting for 22-32% of total TikTok Shop GMV depending on the source and time period. Fashion follows at 12-22%. But raw category size can mislead.
Category velocity matters more than category size. Health and wellness is growing at 55% YoY, food and beverage at 42%, and beauty at 48%. If those rates hold, the top-three category ranking could flip by 2027. A good TikTok Shop product trends report tracks growth rates alongside absolute GMV. You can see how these category dynamics play out in practice through Trenz’s monthly rankings, which track GMV across categories in both the US and UK.
GMV by Region
How GMV distributes across geographies. Southeast Asia was TikTok Shop’s first major market, but the US and UK are growing fastest in percentage terms. Regional reports matter because a product trending in the US may not exist on TikTok Shop UK, and vice versa. TikTok has even launched its first dedicated UK Shopping Report, covering fashion, beauty, tech, and home trends specific to that market.
Buyer Penetration Rate
The percentage of TikTok users who have made at least one purchase through TikTok Shop. In the US, this stands at roughly 45.5%. This metric signals how much room remains for growth. If only half of users are buying, there’s still significant untapped demand.
Seller Count / Shop Count
The total number of active shops on TikTok Shop. With over 475,000 US shops by mid-2025 and 15 million+ global merchants, this metric tracks competitive intensity. Rapid seller growth in a category without proportional GMV growth signals saturation.
The Four Metrics That Matter Most
Although reports contain dozens of metrics, experienced sellers usually prioritize four.
Metric | Why It Matters |
|---|---|
Sales Velocity | Shows current demand momentum |
Contribution Margin | Shows actual profitability |
Creator Concentration | Reveals dependency risk |
Product Lifecycle | Determines timing |
If you only monitor four numbers, these provide the clearest picture of whether a product is worth pursuing.
Product-Level Metrics: What Makes a Product “Trending”
This is the core of most TikTok Shop product trends reports. These metrics help you evaluate individual products and spot opportunities.
Sales Velocity
How quickly units are moving over a defined period, usually daily or weekly. Sales velocity often matters more than total sales volume because it captures momentum. A product selling 500 units per day for three days running is a different opportunity than one that sold 1,500 units over a month. Most third-party tools track this as a time-series graph, letting you see acceleration or deceleration.
Trending Product vs. Viral Product vs. Bestseller
These three terms get used interchangeably in casual conversation, but they mean different things in a trends report.
A trending product is gaining sales velocity, typically showing consistent upward movement over days or weeks. A viral product has exploded in visibility (views, shares, engagement) but may or may not be converting to sales. A product can be viral without being a top seller, and a top seller might not be trending anymore. A bestseller has accumulated the highest total sales in its category over a longer window, often 30 or 90 days.
The distinction is critical for timing. Trending products represent opportunity windows. Bestsellers represent proven demand but also proven competition. Viral products represent attention that may or may not translate to revenue. For more detail on identifying which products fall into which bucket, see this guide on finding winning products.
Product Lifecycle (The 8-16 Week Window)
The average viral TikTok Shop product has an 8 to 16 week commercial life. This is dramatically shorter than Amazon or traditional retail product cycles. A TikTok Shop product trends report should always contextualize a product’s current position within its lifecycle. Is it in the first two weeks (rising), weeks 4-8 (peak), or weeks 10+ (declining)?
The 48-hour clone problem makes this even more urgent. Once a product starts trending visibly, competitors flood in. The window between “this is working” and “everyone is selling this” is measured in days.
Blue Ocean Product
A product opportunity with demonstrated demand but low seller competition. The term comes from the “Blue Ocean Strategy” framework. In TikTok Shop analytics, a blue ocean product typically shows strong search volume or content engagement with relatively few active shops selling it.
This is one of the most valuable signals in a trends report because it identifies where you can enter without immediately competing on price against 50 other sellers. Trenz’s product discovery tools specifically flag blue ocean opportunities alongside sales spike detection.
Niche Score
A composite metric (often displayed as a score out of 10) that combines monthly sales estimates, average revenue per seller, competition density, and growth trajectory to indicate whether a niche promises profitable entry. Different tools calculate this differently, so always check the methodology. A niche score of 9/10 in one tool might not mean the same thing as 9/10 in another.
AOV (Average Order Value)
The average dollar amount per transaction. On TikTok Shop, most sources place the platform-wide AOV between $25 and $35. This number is lower than Amazon or Shopify averages because TikTok Shop is fundamentally an impulse purchase environment. Products in the $20-40 range consistently outperform, hitting the sweet spot between healthy margins and low enough friction for impulse buying.
Price Compression
The observable decline in average transaction prices over time within a category or across the platform. TikTok Shop has experienced a 14.08% decline in average transaction prices, signaling that the platform rewards volume over premium positioning. When you see price compression in a trends report, it means margins are thinning and you need to compensate with higher unit volume or lower acquisition costs.
Return Rate by Category
The percentage of orders returned, broken down by product category. This metric rarely appears in free trends reports but it’s critical for profitability analysis. Fashion and electronics return rates eat 4-9 margin points. Food and CPG categories see just 2-4% returns, which is a major reason CPG brands find TikTok Shop disproportionately profitable despite lower AOV.
Saturation Indicator
A signal (sometimes automated, sometimes manually assessed) that a product category or specific product niche has too many sellers relative to demand growth. Signs of saturation include: declining average GMV per seller, increasing ad costs (CPA), and price compression accelerating beyond the platform average. For frameworks on reading saturation signals alongside competitor activity, this resource on competitor analysis breaks it down further.
How to Read a Product Trends Report in Five Minutes
When reviewing a report:
Step 1
Look for products with increasing sales velocity.
Step 2
Check whether category growth supports the trend.
Step 3
Review creator concentration.
Step 4
Estimate contribution margin.
Step 5
Determine whether the product is early, peak, or declining in its lifecycle.
This simple workflow helps separate sustainable opportunities from short-lived viral spikes.
Content and Engagement Metrics: The Discovery Engine
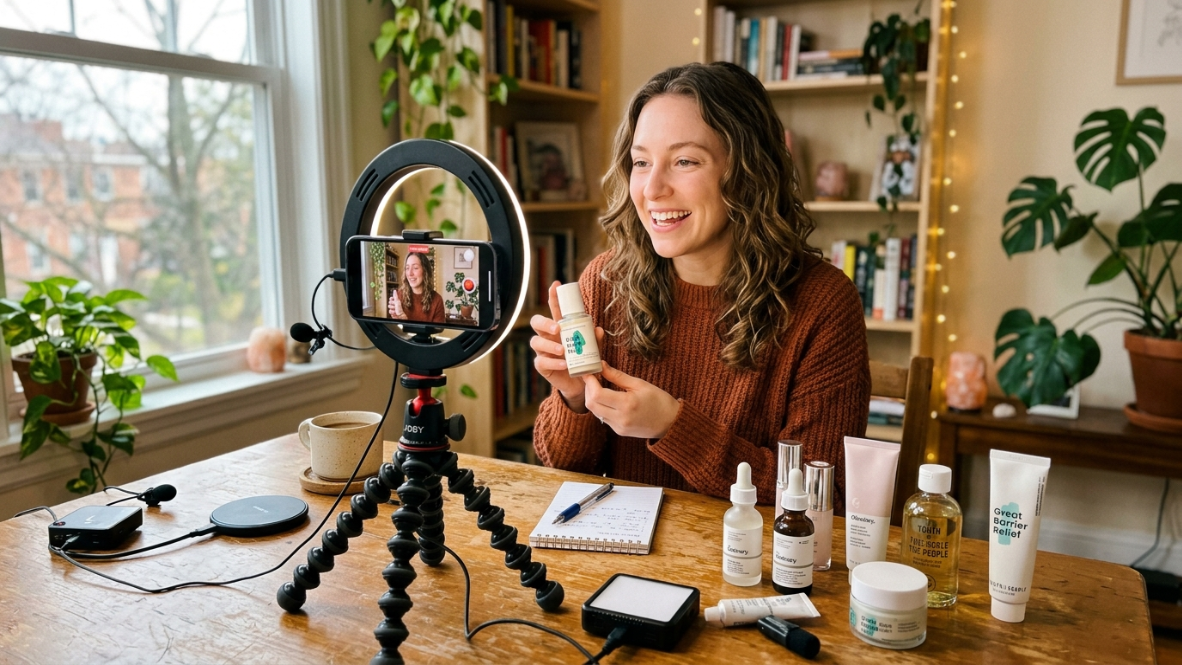
TikTok Shop is not Amazon. Products don’t rise through search rankings and review counts. They rise through content. Understanding content metrics is essential to reading any TikTok Shop product trends report properly.
Shoppertainment
The fusion of shopping and entertainment that defines TikTok’s commerce model. Visual demonstrations and emotional storytelling drive high-velocity sales. This isn’t just a buzzword. It describes the fundamental mechanism: people don’t search for products, they discover them through content that entertains first and sells second.
Content-Driven Discovery
The model where products gain momentum through creator content, organic videos, and ads rather than through search queries and product listings. Short-form video drives nearly 60% of TikTok Shop GMV in the US. This is the single most important structural difference between TikTok Shop and traditional e-commerce.
However, practitioners are noting a shift. Agencies managing TikTok Shop accounts report that more users are searching directly within TikTok Shop for products. The platform is gradually becoming a marketplace, not just a content-driven commerce channel. Product listing optimization for TikTok Shop search is becoming as important as content strategy.
CTR (Click-Through Rate)
The percentage of people who click on an ad or shoppable content after seeing it. TikTok’s Creative Center reports CTR at the product level. A CTR of 0.76% means out of every 1,000 impressions, 7.6 resulted in a click. On TikTok, CTR is heavily influenced by the first few seconds of video, which is why the hook matters so much.
CVR (Conversion Rate)
The percentage of clicks that result in a completed action (usually a purchase). CVR varies widely by format. Standard in-feed ads typically convert at the platform average, but live streaming boasts conversion rates of 5-20%, up to three times higher. Live streaming only contributes about 10% of total GMV, but its conversion efficiency makes it a high-leverage channel for the right products.
CPA (Cost Per Action)
The average amount spent to generate one conversion. CPA is calculated by dividing total ad spend by total conversions. In a trends report, rising CPA for a category signals increasing competition or audience fatigue. Falling CPA signals an efficient channel or underpriced attention.
ROAS (Return on Ad Spend)
Revenue generated for every dollar spent on advertising. A ROAS of 4x means $4 in revenue for every $1 in ad spend. ROAS is the primary efficiency metric for paid campaigns on TikTok Shop. But be careful: ROAS based on GMV looks different from ROAS based on net profit after fees and returns.
6-Second View Rate
The percentage of viewers who watch at least the first six seconds of a video ad. This metric appears in TikTok Creative Center’s Top Products section and serves as a proxy for hook effectiveness. High 6-second view rates correlate with better algorithmic distribution, which drives more organic reach on top of paid impressions.
GMV Max
TikTok’s automated ad campaign type that optimizes bidding and targeting to maximize gross merchandise value. Rather than optimizing for clicks or impressions, GMV Max lets TikTok’s algorithm find the highest-value buyers automatically. It’s increasingly popular but requires sufficient product data and budget to train effectively.
#TikTokMadeMeBuyIt
Both a hashtag and a cultural signal. Products associated with this hashtag have demonstrated viral purchase intent. In a trends report, #TikTokMadeMeBuyIt volume for a product or category serves as a leading indicator of demand. But it’s a blunt instrument. It signals attention, not necessarily sustained commercial viability.
Creator and Affiliate Metrics: Who’s Selling
Creators drive a massive share of TikTok Shop GMV. Understanding creator metrics in a trends report is essential for both sellers partnering with affiliates and creators evaluating product opportunities.
Affiliate / KOL (Key Opinion Leader)
A creator who earns commission by promoting products through content. On TikTok Shop, the affiliate model is the primary sales channel for most sellers. Affiliates create videos featuring products, and when viewers purchase through those videos, the creator earns a percentage.
Creator Concentration
The degree to which a product’s sales depend on a small number of creators. High creator concentration means risk. If 80% of a product’s GMV comes from two or three creators, losing one partnership can collapse sales overnight. A healthy distribution spreads sales across dozens or hundreds of creators.
This metric doesn’t appear in most free tools, but it’s one of the most important signals in a TikTok Shop product trends report for evaluating whether a product’s success is replicable or fragile. For deeper analysis of which creators actually convert versus just drive views, creator analytics tools help quantify this risk.
Commission Rate / Tiered Commission
The percentage of each sale paid to the affiliate creator. TikTok Shop charges sellers a platform commission of about 6% per order. On top of that, top creators now expect 18-22% commission in competitive categories, up from 12-15% two years ago. Some sellers use tiered structures where commission rates increase as a creator hits volume milestones.
Creator ROI
The return on investment from a specific creator partnership, calculated by comparing the GMV (or profit) generated by a creator’s content against the total cost of the partnership (commission, gifted products, flat fees). You can estimate this using a creator ROI calculator before committing to partnerships.
Micro-Creator Network
A strategy of working with many smaller creators (typically under 100K followers) rather than a few large ones. Micro-creator networks reduce creator concentration risk and often deliver better per-dollar ROI because smaller creators accept lower commission rates and have higher engagement ratios with their audiences.
Financial and Operational Metrics: The Margin Reality
The “grow GMV at all costs” era is ending. In 2026, the focus has shifted to growing GMV profitably. SKU-level contribution margin tracking is no longer optional. These metrics define the financial layer of any serious TikTok Shop product trends report.
Contribution Margin
Revenue minus all variable costs (product cost, shipping, platform commission, creator commission, ad spend, returns) for a specific SKU. This is the single most important profitability metric for TikTok Shop sellers. A product can show impressive GMV while losing money on every unit sold once you stack 6% platform fees, 18-22% creator commissions, and category-specific return rates.
To model these numbers before committing to inventory, Trenz’s profit calculator walks through the math step by step.
Referral Fee / Platform Commission
TikTok Shop charges sellers a commission of about 6% on each order, with some category-level variation. This is separate from creator commissions and ad spend. When reading a trends report, always factor this base fee into margin calculations.
Halo Revenue
The additional revenue generated on other channels (Amazon, DTC website, retail) as a result of TikTok Shop visibility and virality. Brands tracking halo revenue are valuing TikTok Shop at 20-40% more than direct GMV alone. This is an underexplored metric that sophisticated sellers use to justify seemingly thin TikTok Shop margins.
Estimated vs. Verified Data
This distinction is critical and almost never addressed in other glossaries. Third-party analytics tools like Kalodata and FastMoss provide estimated data based on scraping and algorithmic modeling. They don’t have access to TikTok’s actual settlement data. Practitioners on TikTok and Reddit consistently flag this gap. As one creator put it directly, “Fastmoss and Kalodata are not accurate for sales.”
Both tools offer valuable directional insights, but achieving 100% accuracy is impossible without an official TikTok analytics tool. Users routinely encounter discrepancies in shop, creator, and product rankings. The practical advice: use these tools for trend identification and relative comparisons, not for P&L decisions. Cross-reference with your own Seller Center data for financial planning. For a detailed look at how different tools handle data accuracy, see this comparison of Kalodata, FastMoss, and alternatives.
Net Margin After Fees
What’s actually left after subtracting product cost, shipping, platform commission (approximately 6%), creator commission (12-22%), ad spend, and returns. Fashion and electronics return rates eat 4-9 additional margin points. This is why CPG and food brands, despite their lower AOV, often find TikTok Shop disproportionately profitable with return rates of just 2-4%.
Report Types and Data Sources
When someone references a “TikTok Shop product trends report,” they could be talking about any of these specific sources. Knowing which is which helps you evaluate what you’re reading.
TikTok Creative Center Top Products
TikTok’s own ad intelligence tool. The Top Products section shows the number of ad creatives featuring a product, CTR, CVR, CPA, ad spend, impressions, and 6-second view rate. It’s free, official, and focused on paid performance. The limitation: it only shows products with active ad campaigns, missing organic-only sellers entirely.
TikTok What’s Next Report
TikTok’s annual cultural trend forecast. The 2026 edition is themed “Irreplaceable Instinct” and predicts macro-level behavioral shifts. Useful for brand positioning and content strategy, not for product-level decisions.
TikTok What’s Next Shopping Trend Report
A commerce-specific companion to the main What’s Next report. It organizes shopping trends into behavioral categories: consumers seeking joy and control, brand-consumer value alignment, and mood-boosting purchase patterns. More actionable than the cultural report, but still directional rather than product-specific.
TikTok Seller Center Analytics
The analytics dashboard inside TikTok’s seller portal. This is the only source of verified first-party sales data for your own shop. It shows actual revenue, orders, traffic sources, and product performance. The limitation: you can only see your own data, not market-wide trends.
Third-Party Analytics Platforms
Tools like Kalodata, FastMoss, and Trenz that aggregate estimated data across the entire TikTok Shop ecosystem. These platforms let you see what competitors are selling, which creators are driving volume, and which categories are growing. As one practitioner comparison noted, “Fastmoss or Kalodata, pick one, they overlap 80%.” The differentiator often comes down to profitability features and data depth. For a detailed breakdown of the best analytics tools, including where each excels and falls short, that comparison guide covers the landscape.
How to Build Your Own TikTok Shop Product Trends Report
Reading other people’s reports is useful. Building your own is better. Here’s a practical framework.
The Cross-Validation Method
No single data source is reliable enough on its own. Combine at least three:
TikTok Creative Center for ad performance data (CTR, CVR, ad spend trends)
A third-party analytics tool for estimated GMV, sales velocity, and creator activity
Google Trends for external demand validation (is interest growing beyond TikTok?)
When all three sources point the same direction, you have a high-confidence signal. When they diverge, dig deeper before committing inventory or budget.
The 60/40 Rule
Experienced TikTok Shop sellers recommend aiming for a portfolio mix of 60% evergreen products that sell year-round and 40% trending products that capitalize on current demand. This balances revenue stability against the upside of riding trends.
Weekly vs. Monthly Cadence
Given the 8-16 week product lifecycle and 48-hour clone window, monthly reports aren’t frequent enough for product-level decisions. Run a weekly review of sales velocity changes, new trending products, and creator activity shifts. Save monthly reviews for category-level analysis, margin assessment, and strategic planning.
Content-Fit as a Filter
The best TikTok Shop sellers think like content creators first and retailers second. Every product decision starts with the question: “How will this look in a video?” If a product doesn’t have a clear visual demonstration, an emotional hook, or a transformation moment, it will struggle on TikTok regardless of what the data says. Factor content-fit into your report as a qualitative filter alongside the quantitative metrics.
Explore Trenz’s analytics platform to see how daily Radar insights, monthly category rankings, and product discovery tools can feed directly into your own reporting workflow.
The 2026 Profitability Context
One final piece of context that shapes how to read every metric in this guide. Operating costs on TikTok Shop are rising. Creator commissions have climbed from 12-15% to 18-22% in competitive categories over the past two years. The platform commission sits at roughly 6%. Returns vary from 2% in food to 9% in fashion. And the 14% decline in average transaction prices means revenue per unit is compressing while costs per unit are expanding.
The sellers who thrive in 2026 are the ones who track contribution margin at the SKU level, not just top-line GMV. A TikTok Shop product trends report that only shows GMV without profitability context is telling you half the story.
Common Mistakes When Using TikTok Shop Trend Reports
Many sellers misinterpret trend reports because they focus on popularity instead of profitability.
Common mistakes include:
Choosing products based only on GMV
Ignoring creator concentration
Entering saturated categories
Assuming estimated data is exact
Following trends after they peak
Ignoring shipping and return costs
Failing to validate demand outside TikTok
Avoiding these mistakes improves long-term profitability.
Choosing the Right TikTok Shop Analytics Tool
Not every analytics platform serves the same purpose.
Need | Best Tool Type |
|---|---|
Product Research | Third-party analytics |
Ad Research | Creative Center |
Competitor Monitoring | Third-party analytics |
Your Shop Performance | Seller Center |
Cultural Trends | TikTok What’s Next |
Profit Analysis | Margin calculators |
Frequently Asked Questions
What is a TikTok Shop product trends report?
It’s any structured analysis that tracks which products are gaining traction, declining, or presenting new opportunities on TikTok Shop. There are three types: official TikTok reports (cultural and shopping trend forecasts), third-party analytics reports (from tools that estimate GMV, sales velocity, and creator data), and custom paid research reports (commissioned analyses of specific niches or markets).
How accurate are third-party TikTok Shop analytics tools?
Directionally useful but not precise enough for financial planning. Tools like Kalodata and FastMoss use estimated data from algorithmic modeling. Practitioners regularly report discrepancies in product and shop rankings. Use them for trend identification and relative comparisons, then cross-reference with your own TikTok Seller Center data for actual P&L decisions.
What metrics matter most in a TikTok Shop trends report?
Sales velocity (how fast units are moving), contribution margin (what you actually keep after all costs), creator concentration (how dependent a product is on a few affiliates), and product lifecycle stage (where a product sits in its 8-16 week window). GMV alone is insufficient because it doesn’t reflect profitability.
How often should I review TikTok Shop trends?
Weekly for product-level decisions, given the 48-hour clone window and short product lifecycles. Monthly for category-level strategy and margin reviews. Daily monitoring through tools like Trenz’s Radar helps catch emerging opportunities before they reach mainstream awareness.
What are the top-selling categories on TikTok Shop in 2026?
Beauty and Personal Care leads with 22-32% of total GMV. Fashion follows at 12-22%. But health and wellness (growing 55% YoY) and food and beverage (growing 42% YoY) are the fastest-expanding categories and may overtake some incumbents by 2027.
What price range works best on TikTok Shop?
Products in the $20-40 range consistently outperform. This bracket delivers healthy enough margins for sellers while staying low enough for impulse purchase behavior, which is the dominant buying pattern on TikTok.
What’s the difference between a trending product and a viral product?
A trending product shows sustained, increasing sales velocity over days or weeks. A viral product has exploded in views and engagement but may not be converting to actual purchases. A product can go viral without becoming a top seller, and a top seller can maintain steady volume without any viral moment.
How do I start building my own TikTok Shop product trends report?
Combine data from at least three sources: TikTok Creative Center for ad performance, a third-party analytics tool for estimated market data, and Google Trends for external demand validation. Apply the 60/40 rule (60% evergreen products, 40% trending) and always filter through content-fit before committing to any product.
Get started with Trenz’s free plan to access daily trend insights, category rankings, and product discovery tools that feed directly into your reporting workflow.
Author


