
TL;DR
TikTok Shop is on track for $112.2 billion in global GMV in 2026, with the US market nearly doubling year over year. Beauty and personal care dominates at 22.5% of total GMV, but supplements are the fastest-growing category. Winning products share five traits: they’re visual in three seconds, solve a real problem, hit the $20-40 impulse price point, feel scarce, and make viewers want to tag a friend. This report breaks down the categories, names the specific products generating millions, compares the research tools worth using, and gives you a step-by-step workflow from trend to tested product.
Browse live TikTok Shop Rankings to see what’s selling right now.
Quick Answer: What Are the Best TikTok Shop Winning Products in 2026?
The best TikTok Shop winning products in 2026 are products that combine high visual appeal, solve a clear customer problem, fall within the $20–40 impulse-buy range, and encourage sharing through short-form video. Based on current GMV and growth data, the strongest categories include beauty, supplements, home products, fashion, food, jewelry, and consumer electronics.
The highest-performing products currently include:
Product | Category | Why It Wins |
|---|---|---|
medicube PDRN Multi Balm | Beauty | Strong before/after demonstrations |
MaryRuth’s Liquid Multivitamin | Supplements | Highly visual daily routine content |
Toplux Magnesium | Supplements | Wellness trend with repeat purchases |
Homeika Cordless Vacuum | Home | Satisfying demonstrations |
Crocs | Fashion | Endless creator-generated content |
NeoCell Collagen | Beauty | High repeat purchase potential |
Rather than chasing every viral product, successful TikTok sellers build repeatable systems that discover trends early, validate demand with creators, test small inventories, and scale only after profitability is proven.
At-a-Glance: TikTok Shop Product Research Tools Compared
Tool | Starting Price | Best For | Products Tracked | Historical Data | Content Creation Built-in? | Key Limitation |
|---|---|---|---|---|---|---|
Trenz | Free (50 credits) | Full pipeline: research + AI video + publishing | 50M+ | Up to 365 days | Yes (video, image, scripts) | Deepest value is TikTok-Shop-first |
Kalodata | $19/mo | Deep product research for solo sellers | Large database | 500 days | No | TikTok Shop only, no content tools |
FastMoss | $14/mo | Creator discovery for agencies | 500M+ | Varies by plan | No | Less transparent methodology |
TikTok Creative Center | Free | Everyone (step one in any workflow) | Platform-native | Limited | No | No GMV or sales data |
PiPiADS | ~$77/mo | Ad intelligence and creative spying | Ad-focused | Ad history only | No | No shop-level sales data |
Shoplus | ~$40/mo | Budget beginners | Smaller database | 90 days | No | Limited depth and creator analytics |
TikTok Shop in Mid-2026: The Numbers That Matter
The scale of TikTok Shop in 2026 makes it impossible to ignore. Projected global GMV sits at $112.2 billion, nearly double the roughly $64.3 billion recorded in 2025. The US market alone generated $15.82 billion in 2025 (a 108% increase from the prior year), and Q1 2026 already hit $4.9 billion, nearly doubling Q1 2025.
But here’s the number that matters most for sellers evaluating this channel: TikTok Shop converts at 4.7%, while other social platforms average just 1.9%. That 2.5x conversion advantage is the reason brands are piling in.
The sales mix tells you exactly how to approach the platform. Short-form video drives nearly 60% of TikTok Shop’s total GMV in the US. Online store listings account for roughly 30%, and live-streaming content generates the remaining 10%. If you’re not making video content, you’re competing for less than a third of the opportunity.
The buyer base has reached 53.2 million in the US, growing 13.6% year over year, with projections reaching 57.7 million by 2026. The demographic skew is pronounced: 70-75% of purchasers are female, which explains why beauty, fashion, and personal care categories dominate.
One stat that keeps sellers grounded: while the US boasts over 475,000 registered shops, more than half recorded zero sales. Only about 2,000 stores exceeded $1 million in GMV in 2025. The platform is massive, but the winners are concentrated.
How TikTok Shop Determines Which Products Go Viral
Video completion rate
Watch time
Shares
Saves
Add-to-cart rate
Conversion rate
Creator engagement
Repeat purchases
Customer reviews
Affiliate participation
The algorithm rewards products that consistently generate engagement and conversions rather than simply accumulating views.
Winning Categories Ranked by GMV and Growth
Every useful TikTok Shop winning products report needs to start with categories, not individual products. Categories tell you where the money flows. Individual products tell you where it’s flowing right now. Both matter, but categories shape your long-term strategy.
1. Beauty and Personal Care
GMV Share: 22.5% | US GMV: $2.49 billion | Content Type: Tutorials, before/after, GRWM
Beauty is the gravitational center of TikTok Shop. It accounts for over one-fifth of all GMV and benefits from the platform’s core demographic. The category rewards visual demonstration: a lip stain that goes on blue and dries red, a serum that visibly tightens skin on camera, a foundation match that looks different in bottle versus on face.
K-beauty products have been particularly strong. The medicube PDRN Pink Collagen Volume Multi Balm, a roughly $25 Korean skincare stick, led all products with about $16.99 million in Q2 2026 revenue alone.
Return rates in beauty tend to be lower than fashion (typically 5-10%), which protects margins. The category also generates strong repeat purchase behavior, something most TikTok Shop winning products reports overlook.
Explore the latest US Skincare Rankings for specific products leading this category.
2. Health and Supplements
Growth: Fastest-growing major category | US GMV (year ending Feb 2026): $784M for supplements alone | Content Type: Routine videos, ingredient breakdowns, transformation stories
Supplements have become TikTok Shop’s single largest Health & Beauty subcategory, outpacing facial skincare. Functional foods grew 265% year over year. The pattern is clear: products linked to visible changes (hair strength, clearer skin, improved sleep) perform best because they give creators something to show.
MaryRuth’s Liquid Multivitamin has crossed $29.9 million in lifetime revenue. Toplux Magnesium hit $14.23 million in Q2 2026 alone. Liquid supplements have gained particularly strong traction because pouring a colorful liquid into a glass is inherently more watchable than swallowing a pill.
Beauty supplements, collagen products, and hair-growth multivitamins are among the platform’s fastest-rising subcategories. The margin profiles tend to be strong (raw ingredient costs are low relative to perceived value), though regulatory compliance adds complexity that casual dropshippers often underestimate.
3. Fashion and Apparel
GMV Share: ~14-20% (Womenswear 12.56%, Menswear 8.06%) | Content Type: Try-on hauls, outfit checks, “find of the day”
Fashion generates enormous volume but demands careful margin math. Crocs led TikTok Shop footwear at $52.4 million. Combined with Hey Dude ($32.5M) and QVC, the top three shoe sellers cleared $99 million from April 2025 through March 2026.
The catch: fashion and electronics return rates eat 4-9 margin points out of already-thin margins. A product with a 20% net margin and 18% returns often becomes a 9% real margin product. Practitioners on Reddit consistently flag this as the category’s biggest trap, noting that returns in fashion are especially brutal for sellers who don’t have automated restocking workflows.
Fashion works on TikTok Shop when the product has a visual hook (a color-changing jacket, a dress with unexpected pockets, shoes that look different from every angle) and when the price point stays under $40.
4. Home and Kitchen
Growth: Strong Q2 seasonal performance | Content Type: Demo videos, cleaning transformations, setup reveals
Home products thrive on TikTok because they lend themselves to satisfying before/after demonstrations. The Homeika Cordless Vacuum has generated $25 million or more in GMV. Wyze Cam hit similar numbers. LED aesthetic lighting remains a perennial performer.
The category benefits from relatively low return rates compared to fashion and a broad appeal that isn’t limited to the platform’s female-skewing demographic. Kitchen gadgets and cleaning products especially benefit from the “oddly satisfying” content format that drives saves and shares.
5. Food and Beverage
Growth: +42% YoY | Content Type: Taste tests, snack reviews, recipe integration
Food and beverage is the dark horse of TikTok Shop. Taste-test content and snack reviews drive impulse buys at price points low enough that purchase friction is nearly zero. The category grew 42% year over year, and the content format is among the easiest to produce: film yourself trying something and reacting honestly.
The limitation is logistics. Perishable goods add fulfillment complexity, and margins on individual food items tend to be thin. The winners here are brands with shelf-stable products, strong packaging aesthetics, and a flavor or ingredient story that gives creators something to talk about.
6. Jewelry and Accessories
Growth: 36% YoY price increase | Content Type: Unboxing, styling, gift guides
Jewelry and accessories represent the highest-margin opportunity on TikTok Shop for sellers who understand the category. The 36% year-over-year price increase signals that buyers are willing to pay more, not less, for pieces they discover through video. High AOVs, gift-driven repeat purchase behavior, and the inherent aesthetic appeal of jewelry make it ideal for the platform.
The margins in jewelry provide the buffer needed to absorb affiliate commissions and platform fees while still maintaining healthy profitability. This is the category where the 30% minimum margin target is easiest to hit.
7. Consumer Electronics
AOV: Highest of any category | Content Type: Unboxing, feature demos, comparison reviews
Consumer electronics commands the highest average order values but the lowest margins. Practitioners in YouTube walkthroughs frequently note that electronics look appealing on GMV leaderboards but the actual profit per unit, after accounting for returns, customer support, and competitive pricing pressure, often disappoints.
The category works best for established brands with existing supply chains, not for new sellers testing products.
Best TikTok Shop Products by Business Model
Business Model | Best Categories |
|---|---|
Beginners | Home Products |
Private Label | Beauty |
Dropshipping | Home Accessories |
Wholesale | Fashion Accessories |
Brand Owners | Supplements |
Affiliate Creators | Beauty Products |
Small Budget | Kitchen Gadgets |
High Margin | Jewelry |
Q2 2026 Winning Products: Named Examples with Data
A TikTok Shop winning products report is only as useful as its specifics. Here are the products generating real revenue right now, with the data to back it up.
medicube PDRN Pink Collagen Volume Multi Balm generated approximately $16.99 million in Q2 2026 revenue. At a ~$25 price point, this Korean skincare stick hits every winning product criteria: visually demonstrable, impulse-friendly pricing, strong before/after potential, and a K-beauty trend tailwind.
Toplux Magnesium followed at $14.23 million in Q2 revenue. Magnesium supplements have become a TikTok staple thanks to sleep and stress content that resonates with the platform’s core audience.
MaryRuth’s Liquid Multivitamin has crossed $29.9 million in lifetime revenue, making it one of the most durable performers on the platform. The colorful liquid format is practically designed for short-form video.
Crocs led all footwear sellers at $52.4 million from April 2025 through March 2026. The brand’s customization angle (Jibbitz charms, color combinations) gives creators endless content variations.
Homeika Cordless Vacuum surpassed $25 million in GMV, riding the “satisfying clean” content trend that consistently performs in the algorithm.
NeoCell Collagen hit $5.57 million in Q2 but showed signs of decline, a useful reminder that even winning products have lifecycles. This is worth monitoring, and you can track shifts like this in our best sellers data.
The pattern across all these winners: they’re visual, they solve a felt problem, and they give creators something worth filming.
The Winning Product Scorecard: 5 Traits That Predict Success
Analysis of thousands of viral products across the platform reveals a consistent set of traits. These aren’t vague guidelines. They’re a filter you can apply to any product you’re evaluating.
Trait 1: Visual in three seconds. The benefit shows on camera immediately. If you need to explain why the product is good, it’s not a TikTok Shop product. Think color changes, before/after transformations, unexpected textures.
Trait 2: Solves a real problem. People feel the pain it fixes. This is the difference between a product that trends for a week and one that sells for months. As the Kalodata team has noted, trend fatigue hits products that relied on novelty rather than solving a genuine problem. The antidote is choosing products with durable utility that happen to be trending, not products where the trend IS the product.
Trait 3: Impulse-friendly pricing. Products in the $20-40 range consistently outperform. High enough for healthy margins, low enough that buyers don’t need to “think about it.”
Trait 4: Hard to find in stores. Scarcity makes people act now. If they can grab it at Target tomorrow, they’ll scroll past your video today.
Trait 5: Wow factor. Viewers want to share it or tag a friend. This is what separates a sale from a viral sale.
Beyond these five traits, the margin math has to work. The standard guidance from experienced sellers: proceed only if you can achieve a 30% or higher profit margin after all expenses, including platform fees, shipping, returns, and affiliate commissions. Run those numbers before committing inventory using a TikTok Shop profit calculator.
How to Find Winning Products: Tools and Workflows
The tools you use determine the quality of your TikTok Shop winning products report, whether you’re building one for your own store or for clients. Here’s how the major options compare, starting with the platform that covers the most ground.
For a more detailed breakdown, see the full tool comparison guide.
1. Trenz

Best for: Sellers who want product research, AI video creation, and publishing in one TikTok-Shop-native workflow.
Pricing: Free plan with 50 credits (no credit card required). Growth, Pro, and Scale tiers with credits-based billing. Additional credits at $10 for 100 credits that never expire.
Key features:
Market Analyst agent scans products across TikTok Shop, Amazon, and DTC
Daily Radar delivers 5 data-backed product picks per day with GMV, growth, and creator-concentration analysis
Monthly Rankings by category and region, tracking over $408.7 million in GMV
AI video, image, and script generation (multiple models including Seedance 2.0, Veo 3.1, Wan 2.6)
Multi-platform scheduling across TikTok, Instagram, YouTube, and Facebook
50M+ TikTok products and 2M+ creators indexed
Limitations:
Deepest value is TikTok-Shop-first; other platforms are supported mainly for publishing
Credit-based model requires budgeting across analysis, images, and video (3 credits/second for video adds up)
AI video quality depends partly on third-party model availability, which can vary by region
What sets it apart: Most tools in this space are analytics-only. They’ll tell you what’s trending, then leave you to figure out content creation, scripting, and publishing on your own. Trenz combines discovery, creation, and distribution in a single workflow, which eliminates the tool-switching that eats hours every week.
2. TikTok Creative Center
Best for: Everyone. This is step one in any research workflow, and it’s free.
Pricing: Free, no ad spend required.
Key features:
Top Products feature shows trending products pulled from TikTok ads
Filter by region, category, and time frame
Data comes straight from TikTok, reflecting actual platform activity rather than third-party estimates
Limitations:
No sales or GMV numbers, only engagement and ad performance data
No historical trend analysis
Limited filtering compared to paid tools
Practitioner perspective: Every guide on this topic recommends starting here. As one frequently cited piece of practitioner advice puts it: “It is the closest thing to a cheat sheet TikTok gives you. Use it before you trust any paid research app.”
3. Kalodata
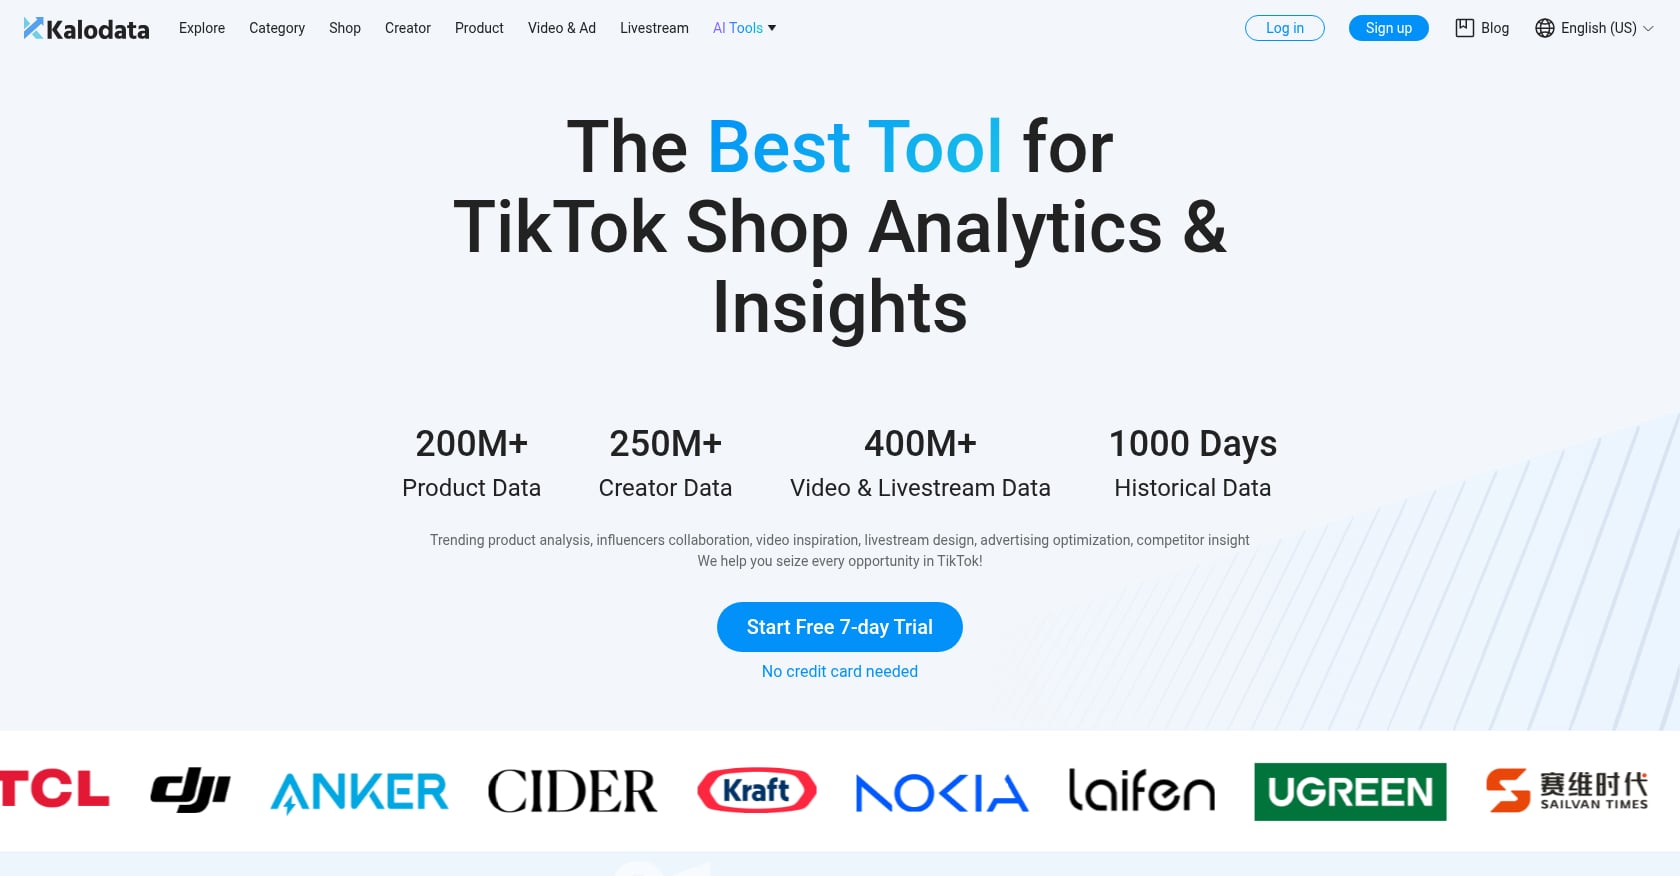
Best for: Solo sellers and small brands focused on deep product research.
Pricing: $19-$199/month, with a 7-day free trial.
Key features:
500 days of historical data with transparent methodology
Built by former TikTok Shop developers
Deep product database with revenue estimates
Strong filtering and sorting capabilities
Limitations:
Focuses entirely on TikTok Shop e-commerce, missing organic content trends and cross-platform data
No content creation tools, leaving video production as a separate problem
Revenue estimates are still third-party approximations, not actual seller data
User sentiment: Multiple comparison reviews position Kalodata as the research-first option. One common recommendation from practitioners on Reddit: “Solo sellers, first product, Kalodata. The $19 plan covers 80% of what you need.” For context on how Kalodata fits against other options, there’s a detailed comparison here.
4. FastMoss
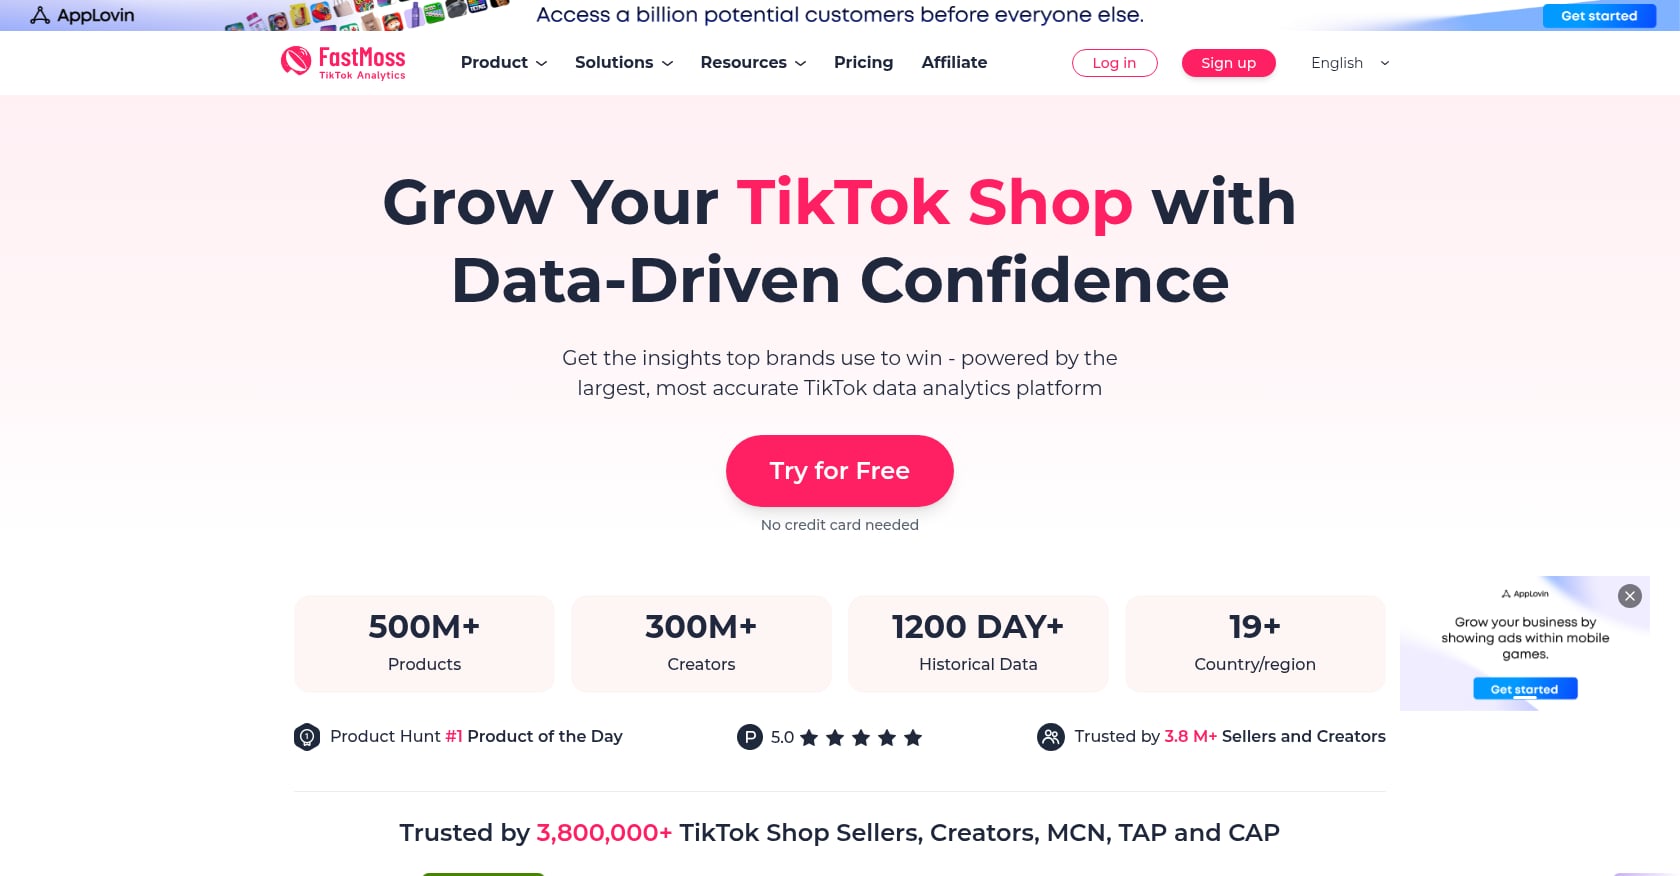
Best for: Agencies and multi-brand operators who prioritize creator discovery.
Pricing: Basic plan at $14/month after a $3 seven-day trial. Pro at $25/month. Ultimate at $46/month. Enterprise plans up to $299/month.
Key features:
Tracks over 500 million products with GMV, conversion rates, and audience insights
Stronger creator dashboards than most competitors
Faster data refresh cycles
Leaderboard tables for quick category scanning
Limitations:
Less transparency about data collection methodology compared to Kalodata
No content creation capabilities
Interface is less polished (practitioners on forums note it’s “uglier than Kalodata” but the leaderboard tables are “genuinely useful”)
User context: FastMoss appears twice in the top 10 Google results for winning product queries, largely through tutorial-style YouTube videos. It’s the go-to for agencies managing multiple brand accounts who need creator-level data.
5. PiPiADS

Best for: Ad intelligence and creative spying.
Key features:
Analyze competitor advertising strategies
Discover products through sustained ad investment patterns
See which products receive consistent ad spend over time, a strong signal of profitability
Limitations:
Ad-only focus with no shop-level or product-level sales data
Doesn’t show organic content performance
Higher starting price (~$77/month) for a narrower feature set
PiPiADS fills a specific niche. If you want to know which products competitors are spending real ad dollars on (not just testing), this tool gives you that signal. But it needs to be paired with a sales data tool to complete the picture.
6. Shoplus
Best for: Beginners on a tight budget.
Pricing: Starting around $40/month with a free tier available.
Key features:
Affordable entry point with functional product search on the free tier
Hourly data updates on paid plans
Simple interface suited for newcomers
Limitations:
Smaller product database than Kalodata and FastMoss
Creator analytics are less detailed
Historical data limited to 90 days on most plans
No AI-powered features
Shoplus works as a starting point, but most sellers outgrow it within a few months as they need deeper data and longer historical windows.
The Research Workflow: From Trend to Tested Product
Having tools is one thing. Knowing how to use them in sequence is what separates sellers who find winners from sellers who chase trends. Here’s the workflow that experienced TikTok Shop operators use.
Step 1: Daily trend discovery. Check TikTok Creative Center for trending products. Cross-reference with a daily intelligence feed (Trenz’s Radar, for example, delivers 5 data-backed picks per day). Look for products appearing across multiple signals: trending in Creative Center, rising in GMV rankings, and gaining creator attention simultaneously.
Step 2: Product shortlisting. Filter candidates against the five-trait scorecard. Check margin math: can you hit 30% net after platform fees, shipping, returns, and affiliate commissions? Eliminate anything that fails the visual test or sits outside the $20-40 sweet spot without a strong reason to go higher.
Step 3: Creator validation. This step is where most sellers skip ahead and lose money. Darkroom Agency’s framework is worth following: send the product to a wide range of creators and watch which ones post organically and which videos earn comments, saves, and shares. Repeat creator activity is a stronger signal of product-market fit than a single viral spike. Agencies scaling to 200+ samples per month are generating the content velocity that the algorithm rewards. You can evaluate creator performance using a Creator ROI Calculator.
Step 4: Content creation. Create 3-5 video variations testing different hooks, angles, and formats. AI video tools can compress this from days to hours. The key is variety: what works as a tutorial might fail as a reaction video, and vice versa.
Step 5: Small test launch. Start with 10-20 units and 3-5 videos. Track not just views but add-to-cart rate, conversion rate, and return rate. A video with 500,000 views and a 0.3% conversion rate is worse than a video with 50,000 views and a 3% conversion rate.
Step 6: Scale what works with data. Double down on the content formats and creator partnerships that produce actual sales, not just engagement. This is where TikTok Shop analytics become essential for tracking what’s actually driving revenue.
For a deeper look at validating products before committing to inventory, read the full product validation guide.
Mistakes That Kill Winning Products
Knowing what works is half the equation. Knowing what destroys margin is the other half.
Chasing dying trends. Late entry into a trending product means razor-thin margins because dozens of competitors are already driving down prices. By the time a product shows up on most “winning products” lists, the early movers have already captured the best margins. The advantage goes to sellers with daily intelligence feeds who spot rising products before they peak.
Ignoring return rates. This is the mistake that catches the most sellers off guard. Fashion and electronics return rates routinely hit 15-20%. A product with a 20% net margin and 18% returns often becomes a 9% real margin product. Factor returns into unit economics BEFORE committing to a category.
Treating GMV tools as profit trackers. The most common mistake sellers make, according to Dashboardly’s analysis: using a market intelligence tool as their profit tracker. These tools show what’s trending across the platform, but they have no access to your store’s actual fees, refunds, or ad costs. Treating scraped GMV estimates as your “profit” leads to scaling products that actually lose money.
Underestimating fulfillment strain. A product that goes from 10 orders a day to 500 orders a day in a week will expose every weakness in your supply chain. Stock-outs during viral moments are permanent missed revenue.
Over-relying on one viral hit. In 2026, volume beats celebrity. Hundreds of smaller creators posting authentic content often outperform a single large partnership. Build a content engine, not a lottery ticket strategy.
Seasonal Calendar: When to Launch by Category
Timing your product launches to seasonal demand patterns is one of the easiest ways to improve your odds. Here’s the quarterly breakdown.
Q1 (January through March): Fitness equipment, organization products, and self-improvement tools peak. New Year’s resolution energy drives purchase behavior. Health and wellness products see their highest quarterly volume. If you’re entering the supplements category, this is your launch window.
Q2 (April through June): Spring and summer products take over. Outdoor gear, fashion, beauty, and festival-related items surge. This is when beauty and personal care categories hit peak content velocity as creators shift to warm-weather routines.
Q3 (July through September): Back-to-school drives electronics and organization categories. Summer beauty (SPF, body care) remains strong through August. Early Q3 is also when smart sellers start sourcing Q4 inventory.
Q4 (October through December): Gift-driven categories explode. Jewelry and accessories benefit enormously from holiday shopping. Home and kitchen products surge for holiday hosting. This is the highest-volume quarter for TikTok Shop overall, and the competition for creator attention peaks alongside it.
The Halo Effect: Why TikTok Shop GMV Understates True Value
One data point that doesn’t appear in most TikTok Shop winning products reports but should: brands tracking cross-channel impact are valuing TikTok Shop at 20-40% more than direct GMV alone.
Social Tale, an agency managing 50+ brands on the platform, reports this “halo effect” on Amazon and DTC sales. A product that trends on TikTok drives search volume on Amazon, increases direct website traffic, and improves branded search performance on Google. The GMV you see in your TikTok Shop dashboard is the floor, not the ceiling.
This means the margin math on TikTok Shop doesn’t need to be as aggressive as it looks on paper, especially for brands that sell on multiple channels. A product that breaks even on TikTok Shop but drives $50,000 in incremental Amazon sales is a winner by any definition.
What Comes Next
TikTok Shop’s trajectory is clear: more sellers, more competition, and higher GMV concentrated among the operators who combine data-driven product selection with consistent content output. The window for easy wins is closing. The window for systematic, tool-assisted winning is wide open.
The sellers who thrive in this environment aren’t the ones who found one viral product. They’re the ones who built a repeatable process for finding the next one, and the one after that.
Start finding winning products with Trenz, from discovery through content creation to publishing, in one workflow.
FAQ
How often should I check a TikTok Shop winning products report?
Daily for trend signals, weekly for category shifts, monthly for strategic planning. Product lifecycles on TikTok move faster than on Amazon or Shopify. A product can go from unknown to $10 million in revenue and back to declining within a single quarter. Daily intelligence feeds (like Trenz’s Radar) catch rising products before they hit mainstream lists.
What profit margin should I target for TikTok Shop products?
Aim for 30% net margin or higher after all costs: product cost, shipping, platform fees (typically 5-8%), affiliate commissions (10-20%), returns, and ad spend if applicable. Products below this threshold leave no room for the unexpected costs that inevitably arise, especially returns in fashion and electronics categories.
Are free tools enough for TikTok Shop product research?
TikTok Creative Center is a strong free starting point, and Trenz offers a free plan with 50 credits. These will get you started with trend discovery and basic research. But for historical data, GMV estimates, and creator analytics, paid tools significantly reduce the guesswork. Most successful sellers use a free tool for initial scanning and a paid tool for validation.
What’s the best price point for TikTok Shop products?
The $20-40 range consistently outperforms. It’s high enough to support healthy margins after platform fees and commissions, but low enough to trigger impulse purchases. Products under $15 struggle with margin after all costs. Products over $50 require stronger trust signals and typically need more sophisticated content strategies.
How do I validate a product before ordering inventory?
Follow the creator seeding method: send samples to 10-20 creators across different audience sizes. Watch for organic posts (not just paid placements), comment sentiment, saves, and shares. If multiple creators post without prompting, that’s a strong product-market fit signal. Then run a small test with 10-20 units and 3-5 video variations before scaling.
Why do most TikTok Shops fail to make sales?
Over half of the 475,000+ registered US shops recorded zero sales in 2025. The primary reasons: choosing products without data validation, insufficient content volume, poor margin math, and treating TikTok Shop like a passive marketplace rather than a content-driven platform. Short-form video drives 60% of GMV, so shops without a consistent video strategy are effectively invisible.
How does TikTok Shop’s conversion rate compare to other platforms?
TikTok Shop converts at 4.7%, compared to an average of 1.9% across other social commerce platforms. Live shopping sessions convert even higher, often hitting 6-8% during well-executed streams. This conversion advantage is the core reason brands are shifting budget to TikTok Shop despite the platform’s operational complexity.
What categories should new TikTok Shop sellers avoid?
Consumer electronics offers the highest average order values but the lowest margins and highest return rates. Fashion generates massive volume but return rates of 15-20% can destroy profitability for unprepared sellers. New sellers are better served starting in beauty, supplements, or home/kitchen categories where return rates are lower and the content format is more forgiving.
Author


