TL;DR
TikTok Shop is on track to hit $23.4 billion in US sales this year, but most sellers can’t tell if they’re actually profitable. The best TikTok Shop analytics tools solve different problems: Trenz covers the full pipeline from product discovery to AI video creation to GMV tracking. Kalodata and FastMoss lead in market intelligence. Dashboardly handles profit tracking at the SKU level. Your pick depends on whether you need to find products, prove profitability, or unify your entire workflow.
What Is the Best TikTok Shop Analytics Tool in 2026? Direct Answer
The best TikTok Shop analytics tool for most sellers in 2026 is Trenz because it combines product research, creator intelligence, AI content creation, social publishing, and GMV tracking in one platform.
However, the right tool depends on your goal:
Goal | Best Tool |
|---|---|
All-in-one workflow | Trenz |
Product research | Kalodata |
Multi-country market intelligence | FastMoss |
Profit tracking | Dashboardly |
Ad creative research | PiPiADS |
Budget-friendly research | Shoplus |
Free beginner option | SimpTok |
Native store analytics | TikTok Seller Center |
For sellers managing multiple subscriptions, an end-to-end platform often reduces software costs and workflow friction compared to maintaining separate research, content, and reporting tools.
Why TikTok Shop Analytics Matter in 2026
TikTok Shop is projected to generate $23.41 billion in US ecommerce sales in 2026. That makes it larger than Target, Costco, Best Buy, or Kroger’s online businesses. More than 80.4 million Americans now buy through TikTok Shop, and US social commerce overall will surpass $100 billion this year.
The conversion numbers explain why sellers are flooding in. TikTok Shop converts at 4.7%, more than double Instagram Shopping’s 2.1% and nearly triple Facebook Shops’ 1.8%. The global average for ecommerce sits at just 1.9%.
But here’s the problem nobody talks about in the hype: TikTok’s Seller Center shows GMV (gross merchandise value), not profit. A seller hitting $100K in GMV might be clearing $15K in real profit, or losing money entirely. Real revenue typically runs 18 to 35% lower than GMV after fees, returns, commissions, and ad spend. Without proper analytics, you’re flying blind.
This is why the best TikTok Shop analytics tools have become essential. They fall into three categories:
Market intelligence tools that show what’s selling across TikTok Shop (Kalodata, FastMoss, Shoplus)
Profit tracking tools that connect to your store and calculate actual margins (Dashboardly)
End-to-end platforms that combine discovery, content creation, publishing, and GMV tracking (Trenz)
Most sellers end up stitching together 3 to 5 disconnected tools. That’s expensive and time-consuming. Understanding which category you actually need is the first step toward picking the right tool.
Explore Trenz’s platform to see how an all-in-one approach works.
How We Evaluated These Tools
Every tool on this list was assessed across five dimensions:
Feature depth: Does it solve one job or multiple jobs in the seller workflow?
Pricing transparency: Are real numbers published, or do you have to “contact sales”?
Real user sentiment: What are practitioners on Reddit, G2, and Capterra actually saying?
TikTok Shop integration depth: Official partner status, API connections, data freshness
Coverage breadth: Number of products indexed, markets supported, historical data available
Full disclosure: this article is published on Trenz.ai. Trenz appears as our top recommendation because it’s the only tool that spans the entire discovery-to-GMV pipeline. We’ve been transparent about its tradeoffs, including the credit-based pricing model and its TikTok-first focus.
Quick Comparison Table
Tool | Best For | Starting Price | Free Tier/Trial | Key Strength | Key Gap |
|---|---|---|---|---|---|
Trenz | End-to-end sellers & agencies | Free (50 credits) | Yes, no CC | All-in-one: discovery + AI video + publishing + GMV | TikTok-first; credit budgeting needed |
Kalodata | Product research & creators | ~$38/mo | 7-day trial | 500-day history, clean UI, ex-TikTok team | Analytics only, prices rising |
FastMoss | Agencies & multi-market ops | ~$49/mo | 7-day trial | 200M+ products, LIVE data, 9 markets | Overwhelming UI, accuracy concerns |
PiPiADS | Paid media teams | $49/mo | 500 free credits | 50M+ ad creatives, cross-platform spy | Ad-only, needs $3K+/mo ad spend to justify |
Dashboardly | Profit tracking (P&L) | $29/mo | 14-day trial | Verified profit per SKU, agency mode | No market intelligence, TikTok-only |
Shoplus | Budget beginners | ~$14.90/mo | 3-day trial | Hourly updates, lowest price | Accuracy concerns, limited depth |
SimpTok | $0 budget starters | Free | Always free | Zero cost, guided worksheets | Outgrown fast |
TikTok Seller Center | Everyone (baseline) | Free | N/A | Official data, always accurate for your store | No profit tracking, no market intelligence |
What Data Should a TikTok Shop Analytics Tool Track?
The best TikTok Shop analytics software should track more than sales volume.
Key metrics include:
Gross Merchandise Value (GMV)
The total value of products sold through TikTok Shop before deductions.
Net Revenue
Revenue after platform fees, creator commissions, discounts, refunds, and returns.
Profit Margin
The percentage of revenue remaining after product costs and operational expenses.
Creator Performance
Which affiliates, influencers, and creators generate actual sales rather than views.
Product Velocity
How quickly products gain traction across TikTok Shop.
Content Attribution
The relationship between specific videos and resulting sales.
Many sellers mistakenly optimize for GMV while overlooking profitability, making profit attribution one of the most important analytics capabilities in 2026.
The 8 Best TikTok Shop Analytics Tools
1. Trenz
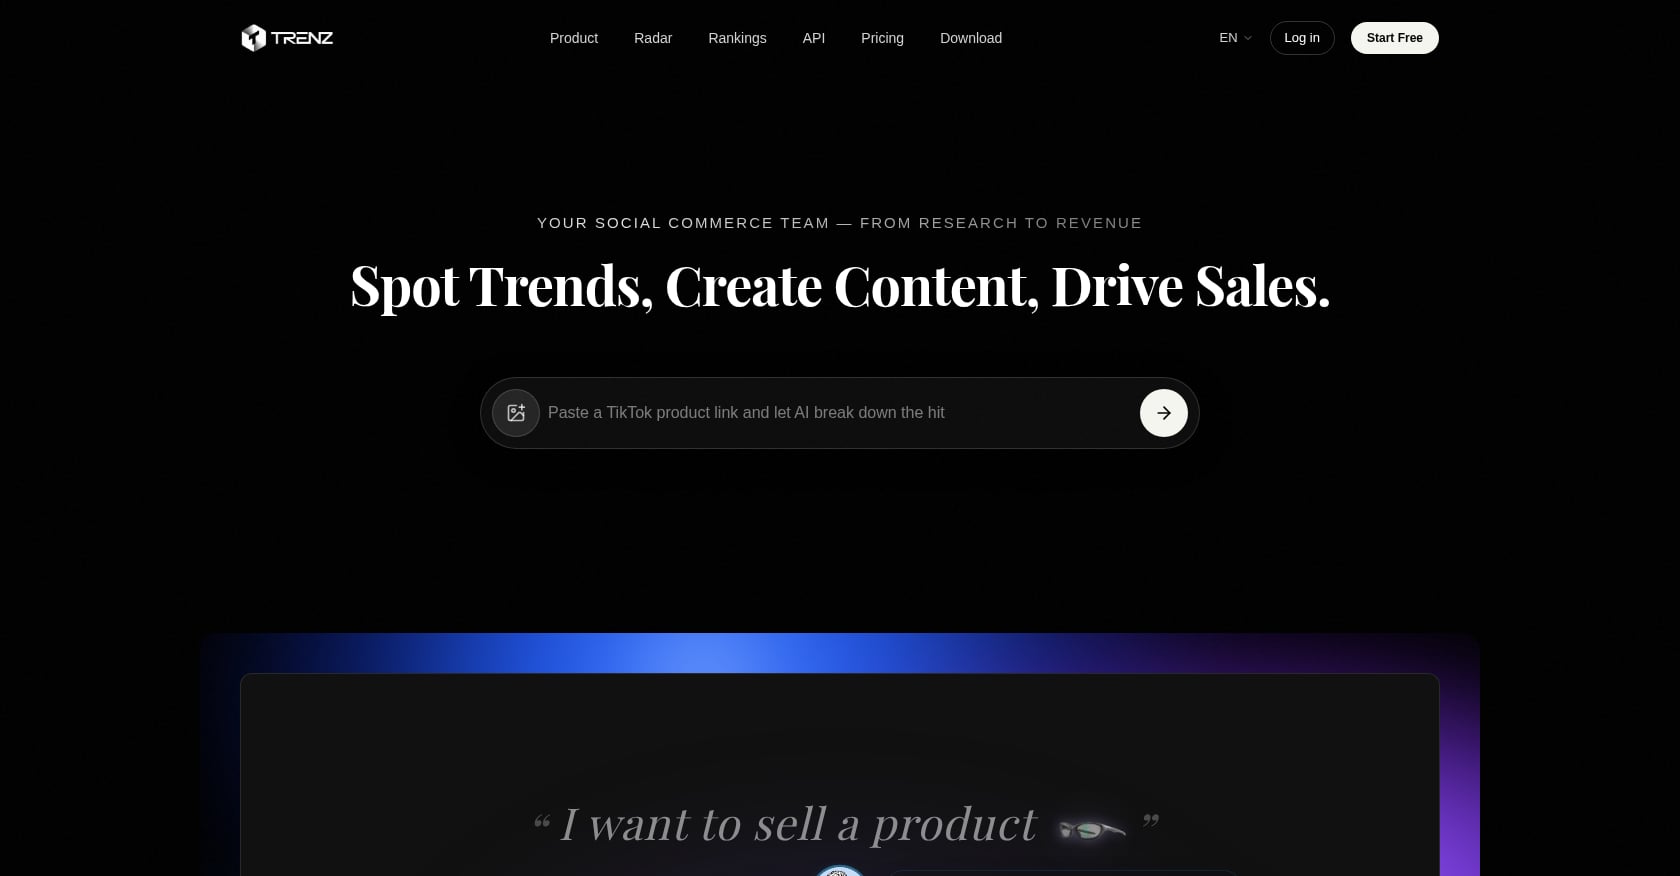
Best for: Sellers and agencies who want product discovery, AI video creation, social publishing, and GMV tracking in one platform instead of juggling 4+ separate tools.
Pricing:
Free: 50 welcome credits, 1 social account, 7-day data history, no credit card required
Growth: 250 credits/month, 3 social accounts, 90-day history
Pro: 650 credits/month, 10 social accounts, 180-day history, +20% bonus on credit top-ups
Scale: 1,800 credits/month (shared pool), 50 social accounts, 365-day history, team workspace at $19/seat/month, +50% bonus on top-ups
Credit top-ups: $10 = 100 credits (purchased credits never expire)
API: Pay-as-you-go at $0.15/credit, Enterprise at $0.10/credit
Typical task costs: Quick Q&A (1 credit), AI image (1 credit), market analysis (5 credits), product discovery (~10 credits), video generation (~12 credits).
Key features:
Daily Radar: 5 data-backed product and market opportunities per day for the US and UK, including GMV data, growth metrics, and creator-concentration analysis. Check the daily Radar or browse the Radar archive for past picks.
Monthly TikTok Shop Rankings by category and region, with $408.7M+ in tracked GMV. See current examples like the US Skincare rankings or US Makeup rankings.
Market Analyst agent: Blue Ocean product discovery, sales spike detection, and seasonal bestseller tracking across TikTok Shop, Amazon, and DTC channels
Creative Director agent: AI video generation averaging ~60 seconds using Seedance 2.0, Veo 3.1, and Wan 2.6 models, plus script templates, hooks, angles, and formulas sourced from top-GMV videos
Social Manager: Schedule and publish to TikTok, Instagram, YouTube, and Facebook from one calendar, with best-time-to-post insights and a unified comments/messages inbox
Open API: 50M+ TikTok products and 2M+ creators indexed, with unified endpoints for commerce data, AI content generation, social publishing, and ads management
Trenz is a claimed Official TikTok Shop Partner.
What makes it different:
No other tool on this list connects product intelligence to content creation to publishing to GMV tracking. The platform uses three AI agents (Market Analyst, Creative Director, Social Manager) coordinated by an orchestrator called Trenzer. This agent-based approach means you’re not staring at dashboards trying to figure out what to do next. You ask questions, get analysis, and take action in the same interface.
For developers and agencies, the Open API is notable. Most competing tools either have no API (Dashboardly) or restrict API access to enterprise tiers (Kalodata). Trenz offers a unified API key covering commerce data, AI generation, and social operations.
Tradeoffs:
Deepest value is TikTok-first. Other platforms are supported mainly for publishing, not full commerce data.
The credit model is transparent but requires planning. Video generation at 3 credits per second adds up for longer content.
Base plan prices for Growth, Pro, and Scale tiers aren’t publicly displayed on the site. You can see the credit allocations and features clearly, but estimating your total monthly cost takes a test cycle.
See full pricing details to estimate your credit needs.
2. Kalodata
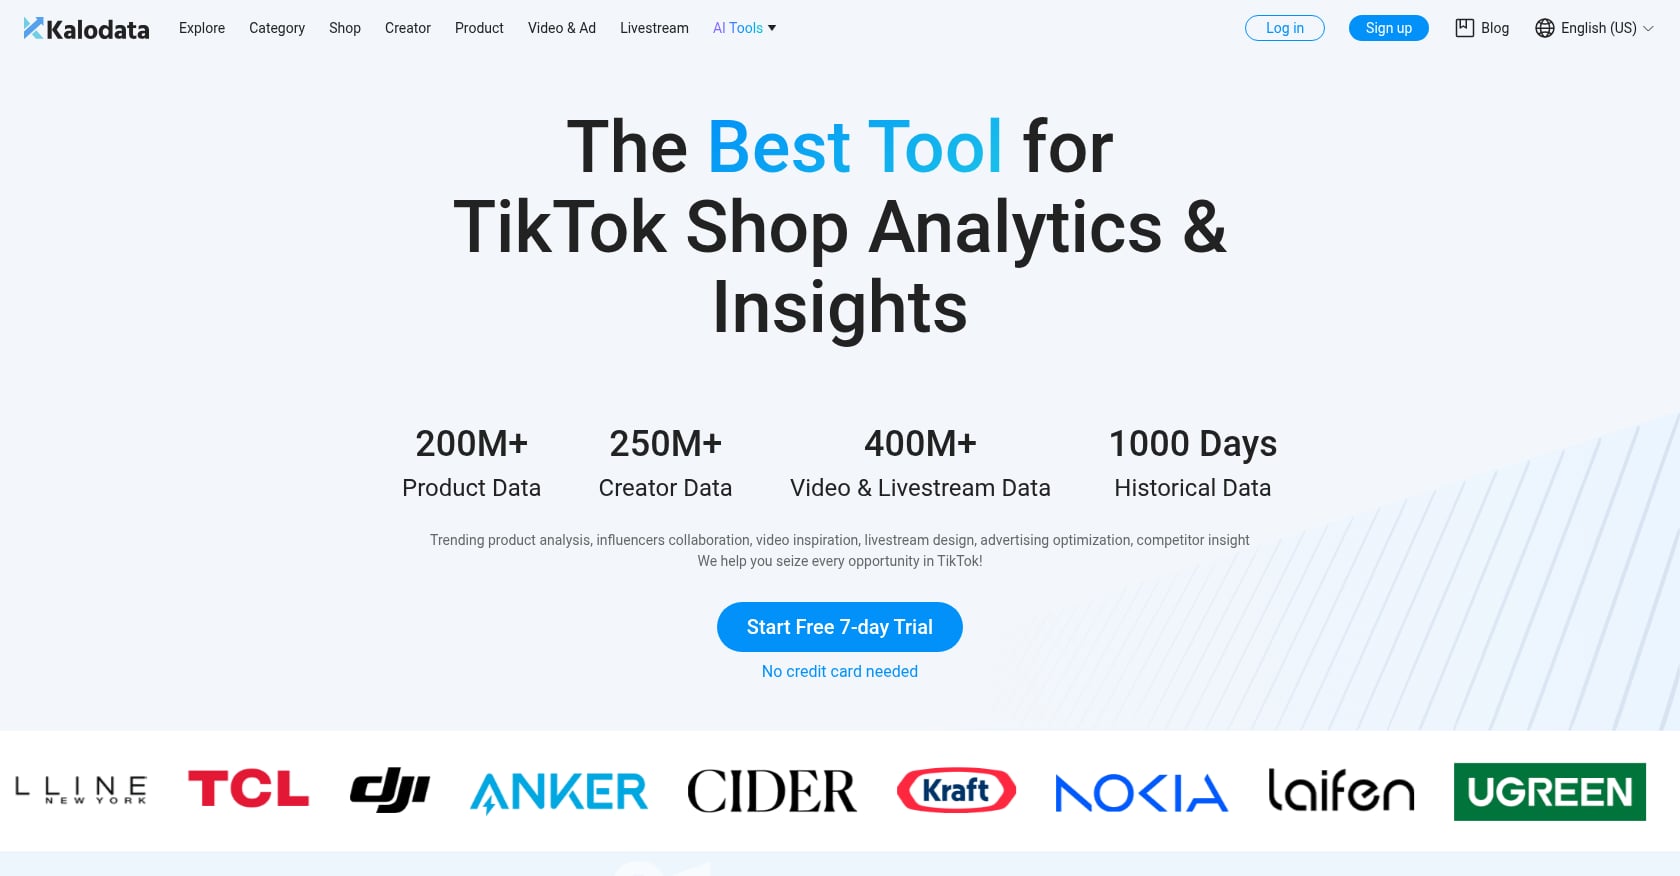
Best for: Individual sellers and affiliates focused on product research and creator discovery who want a clean, familiar interface.
Pricing:
Starter: ~$38.30/month (50 searches/day, 100 detail pages/day, 90-day data range)
Professional: ~$83.20/month (250 searches/day, 500 detail pages/day, 180-day data range). Note: the Professional plan recently increased from $99.99 to $109.99/month at full price.
Enterprise: Custom pricing with API access and consultation
7-day free trial, no credit card required
Key features:
500 days of historical data with transparent methodology
Trending products, creator discovery, short video analytics, and livestream tracking
Video hover-preview feature that speeds up research significantly
Management team includes former members of TikTok’s global e-commerce division who helped build TikTok Shop
Real user perspective:
A Capterra reviewer noted that “the UI is kind of bland compared to competitors” and that “a lot stays behind the paywall for the free trial unlike competitors.” WinningHunter’s independent analysis scored Kalodata 7.0 out of 10, praising its dashboards as easy to navigate with clear strength in trend tracking and creator discovery.
Practitioners on Reddit frequently compare Kalodata against FastMoss, and it’s one of the most common “which should I pick?” discussions in TikTok seller communities. The general consensus: Kalodata has a cleaner interface but costs more per feature than it used to.
Tradeoffs:
Analytics only. No content creation, no publishing, no profit tracking.
The free tier provides extremely limited access, essentially a demo. With minimal daily lookups and restricted data, it’s not usable for real business decisions.
Pricing has been increasing. Sellers who’ve been on the platform for a year or more report feeling the squeeze.
For a deeper comparison, see our Kalodata alternative analysis.
3. FastMoss
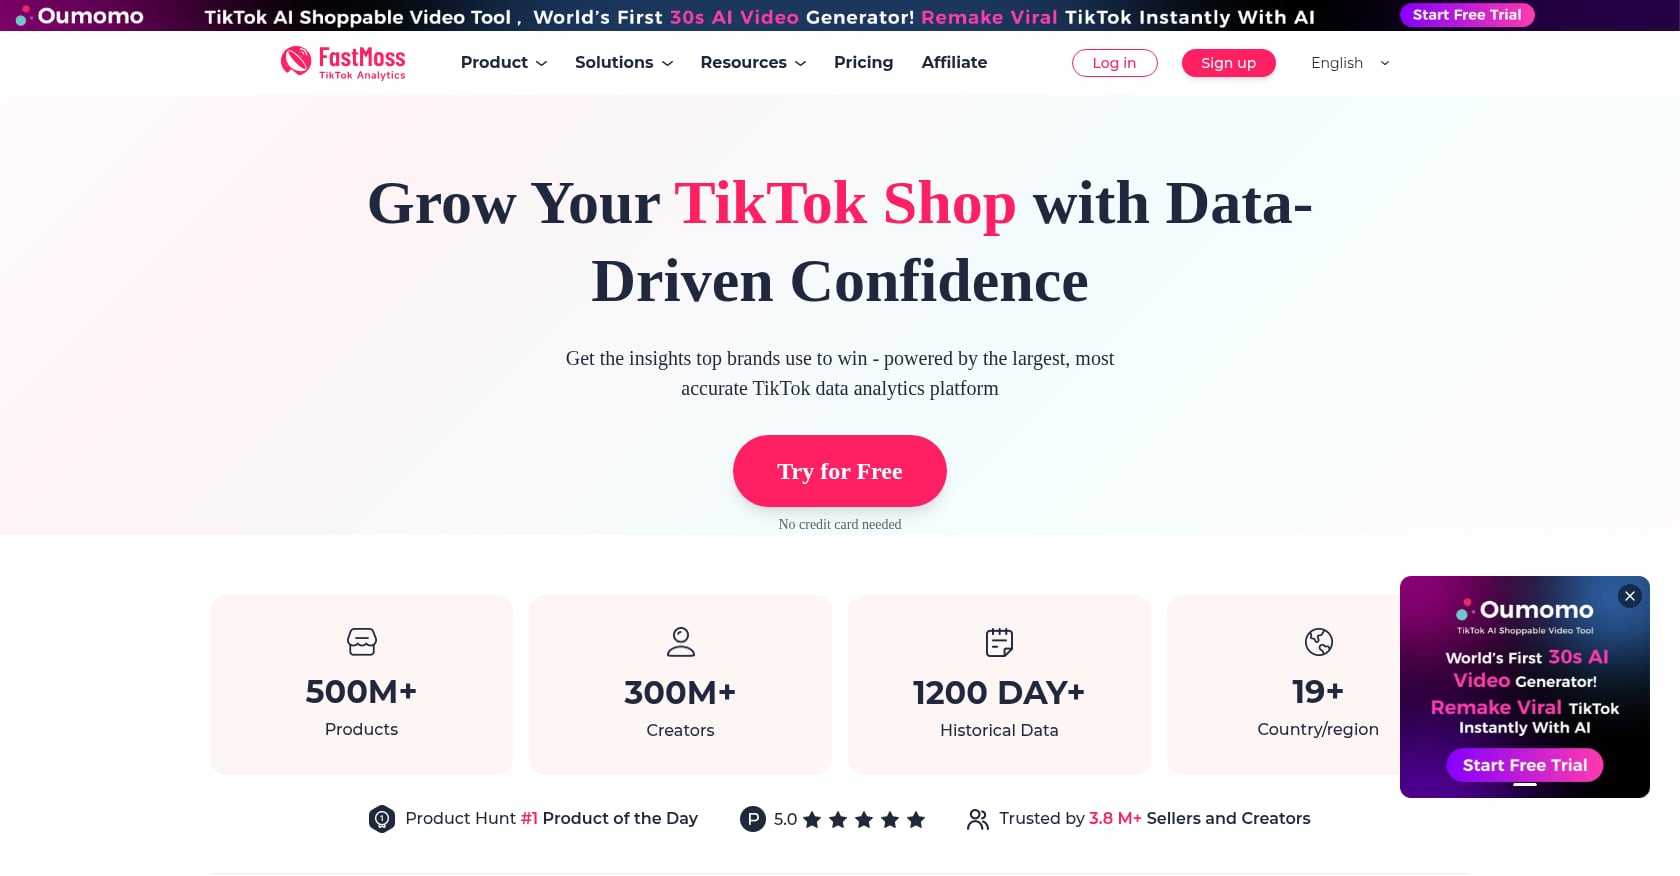
Best for: Agencies, MCNs, and brands running multi-market TikTok operations who need the widest data coverage available.
Pricing:
Basic: ~$49/month
Professional: ~$53 to $109/month depending on billing period
Premium: ~$89 to $199/month depending on billing period
7-day free trial (auto-renewing subscription, so mark your calendar)
Frequent promotional discounts of 50%+ off
Key features:
Tracks over 200 million products across TikTok Shop
Covers 9 TikTok markets: US, UK, Germany, France, Indonesia, Vietnam, Thailand, Malaysia, and the Philippines
LIVE analytics, ad creative intelligence, and granular data categories beyond just product research
Claims 3.8M+ sellers and brands on the platform
Real user perspective:
Practitioner sentiment on FastMoss is split. On Reddit, some early users said they wanted “a dashboard that tracks viral videos and live sales in one place,” and FastMoss delivers on that. But a FindNiche comparison noted that “compared to other tools, the data FastMoss presents is less accurate.” Other reviewers called it a “gamechanger” while admitting the interface felt overwhelming at first.
One common complaint across forums involves billing. Multiple users have reported issues with auto-renewal and customer support responsiveness.
Tradeoffs:
FastMoss and Kalodata are both market intelligence tools. Neither connects to your store’s actual fees, ad spend, or refunds. You still can’t see profit.
The interface has a steep learning curve, especially for beginners.
Data accuracy has been questioned by multiple independent reviewers.
No content creation or publishing capabilities.
For sellers weighing FastMoss against alternatives, our FastMoss alternative breakdown covers the key differences in detail.
4. PiPiADS
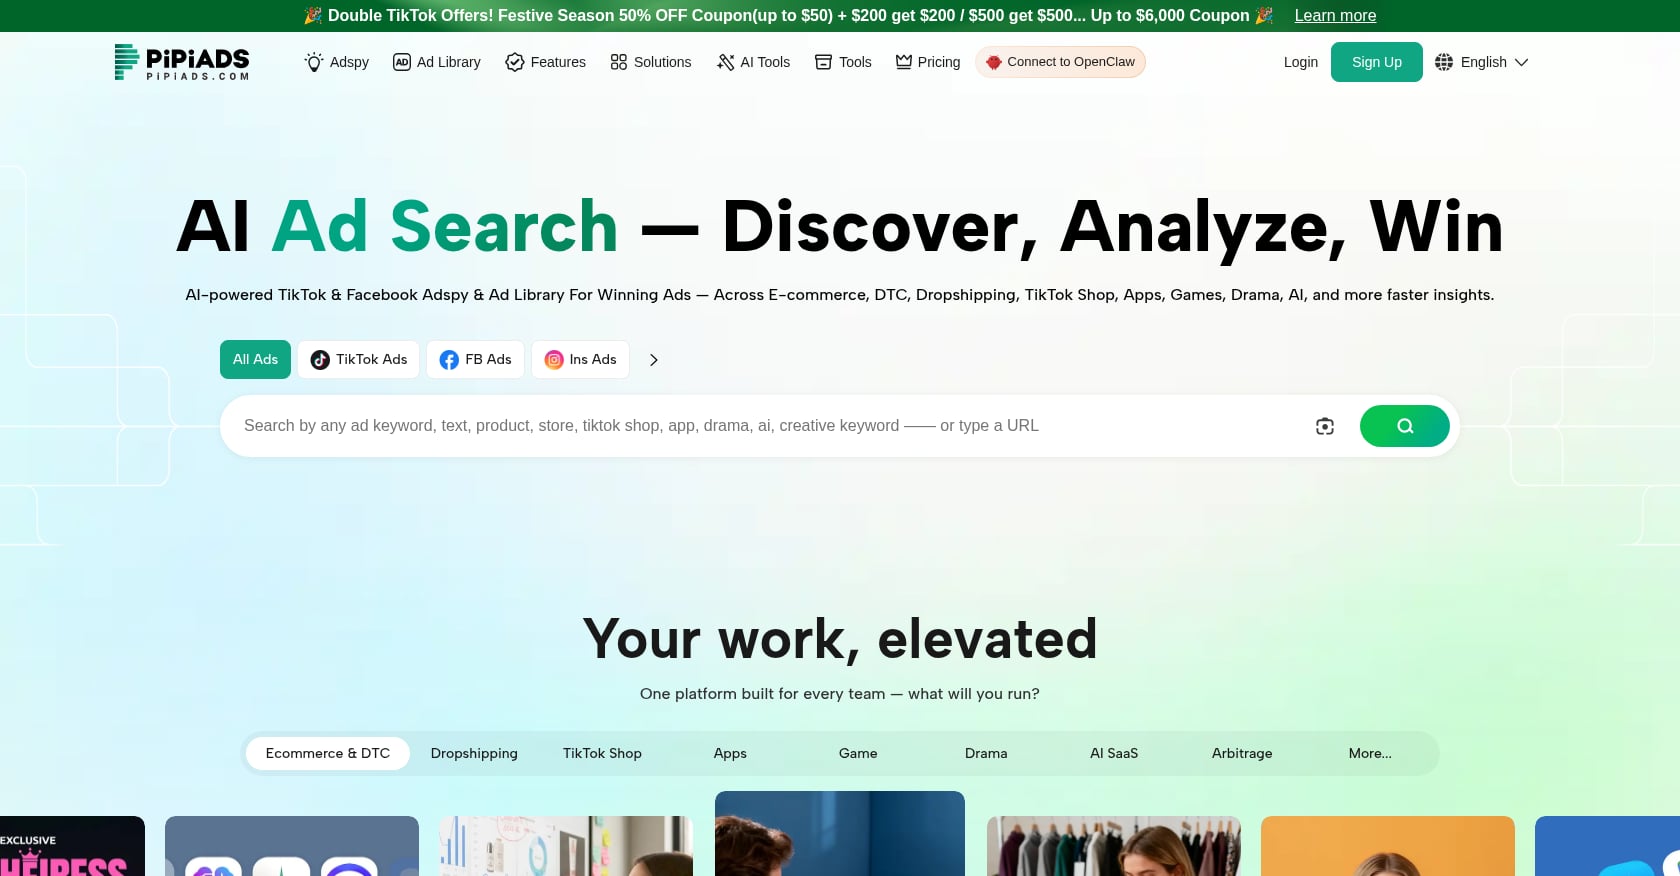
Best for: Paid media teams and dropshippers who need ad creative intelligence across TikTok and Meta platforms.
Pricing:
Basic: $49/month
Advanced: $99/month
Flexible: Starting at $180/month (credit-based 2.0 system)
Enterprise: $900/month
Free trial with 500 credits; $1 for a 3-day premium trial
Key features:
Access to over 50 million ad creatives with 100,000 new ads added daily
Indexes active ads across TikTok, Facebook, Instagram, and Audience Network
TikTok Shop product library and winning products feature
Advertiser analysis to see what competitors are spending on
Real user perspective:
A G2 reviewer shared: “Pipiads saves me so much time when doing ad research. I can quickly find trending TikTok ads, see what competitors are running, and get ideas for creatives.” Another G2 user was more measured: “Not cheap, but definitely worth it if you’re serious about TikTok ads.” On the negative side, PiPiADS has received criticism for unresponsive customer service across multiple review platforms.
Tradeoffs:
Focused specifically on ad intelligence, not organic shop analytics. If you’re not running paid ads, this tool won’t help you.
PiPiADS typically starts delivering strong ROI only when sellers reach $3K to $5K in monthly ad spend on Meta or TikTok. Below that threshold, the subscription cost is hard to justify.
Not worth it for absolute beginners. Free native tools will serve you better until you’re actively spending on ads.
See our PiPiADS alternative comparison for a fuller look at where it fits.
5. Dashboardly
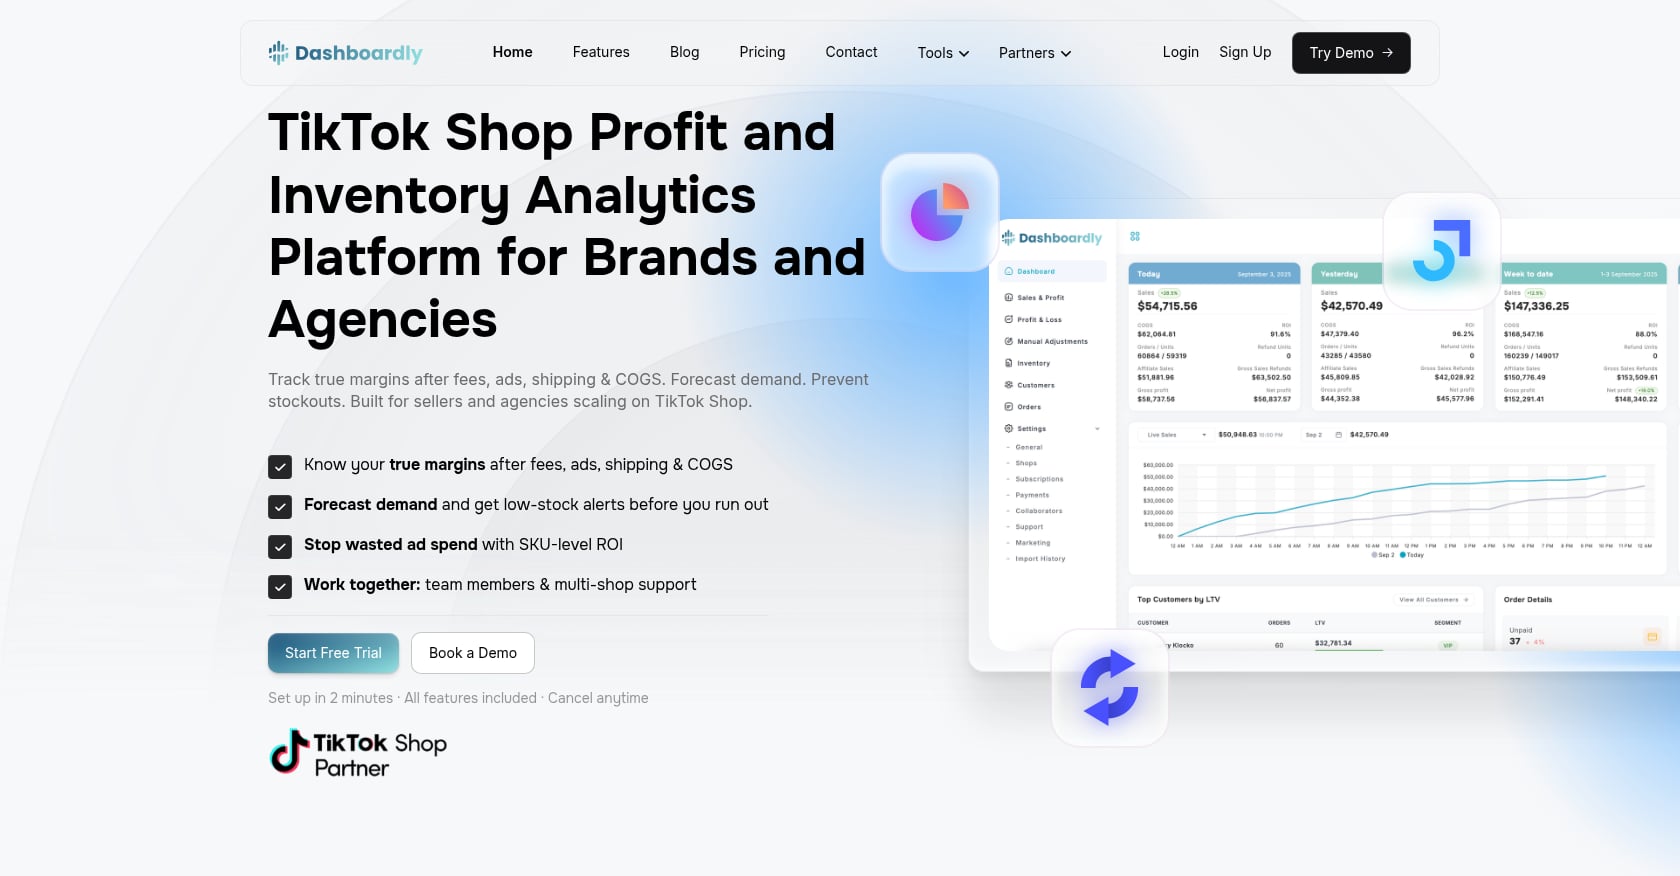
Best for: Established sellers and agencies who have demand but need verified, order-level profit tracking.
Pricing:
Starting at $29/month
14-day free trial
Flex order system with per-order overage as low as $0.004/order
Agency tiers: $249 to $599/month
Key features:
Verified TikTok Shop Partner that pulls data through official APIs, meaning numbers reconcile against actual TikTok payouts
Profit analytics at the order and SKU level, matching every fee, refund, and payout adjustment to individual orders
Inventory management with demand forecasting and low-stock alerts
Multi-shop dashboard for agencies managing multiple stores
Real user perspective:
One Dashboardly user reported: “Switched from spreadsheets and saved 6+ hours a week. Now I see true profit per SKU after fees, ads, and COGS, no more guesswork.” That sentiment captures exactly why profit tracking tools exist. Seller Center tells you GMV happened. Dashboardly tells you whether you made money.
Tradeoffs:
Not a market intelligence tool. It won’t show you competitor trends, trending products, or creator analytics.
No API available. Custom integrations or automated reporting aren’t an option.
Only integrates with TikTok. If you sell on other channels, you’ll need separate profit tracking.
Complementary to research tools, not a replacement. Think of it as one layer of your analytics stack.
6. Shoplus
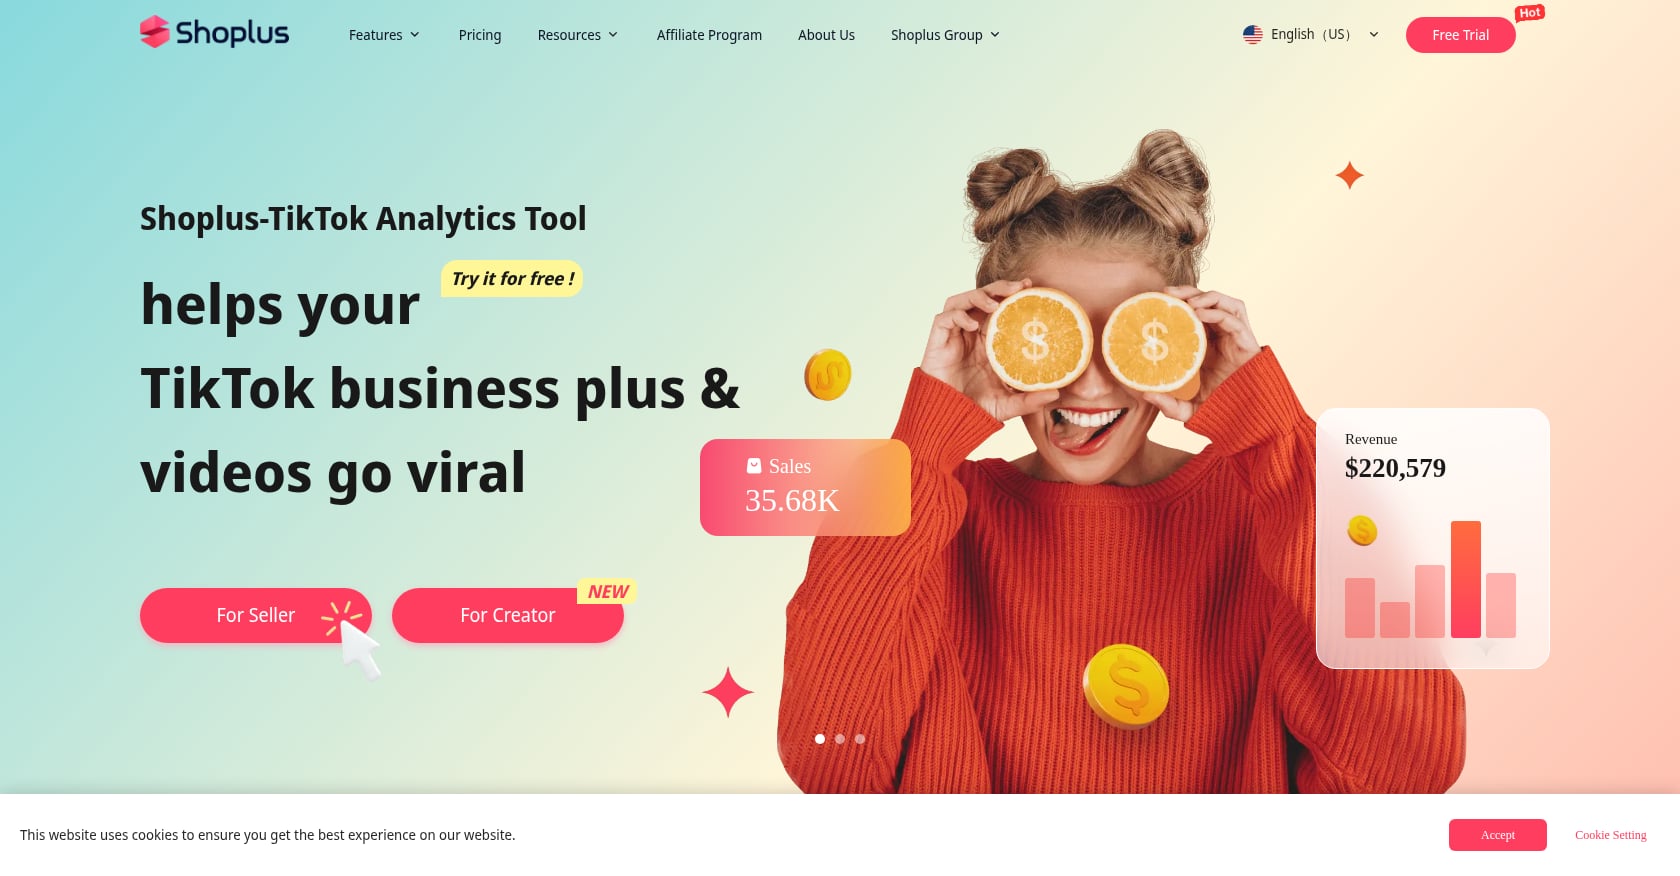
Best for: Budget-conscious beginners and small teams who want a simple, affordable entry point for TikTok Shop competitive research.
Pricing:
Basic: $14.90/month
Premium: $69/month
Professional: $99/month
3-day free trial
Key features:
TikTok ads updated every hour, best-selling product lists and top sales influencers updated every 6 hours
Product, shop, video, and influencer discovery
Real-time monitoring with clear pricing tiers
Real user perspective:
Practitioners describe Shoplus as a solid fit for smaller teams running their first structured competitive research on TikTok Shop. The platform is easier to budget for than Kalodata or FastMoss. However, multiple user reports mention inconsistent data accuracy. The practical advice from experienced sellers: treat Shoplus as a starting point for generating ideas, not as a source of truth for making big inventory bets.
Tradeoffs:
Data accuracy concerns from multiple independent sources
Not suitable for downstream finance tracking or affiliate operations at scale
Limited historical data compared to Kalodata’s 500-day window
You get what you pay for. The low price reflects a narrower feature set.
7. SimpTok
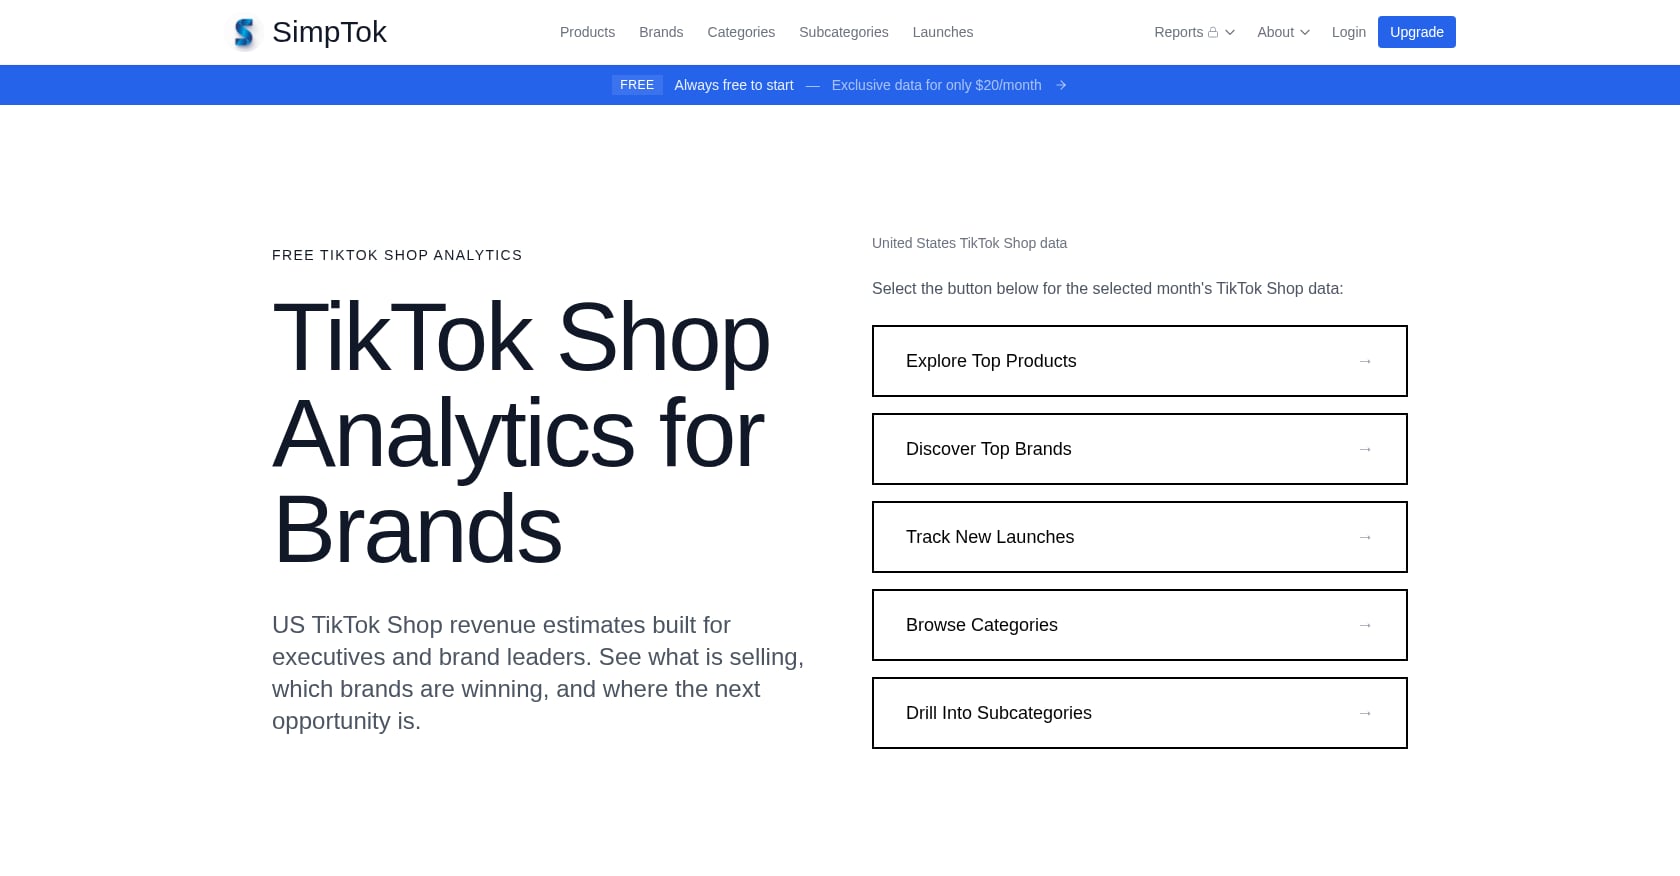
Best for: Complete beginners on a $0 budget who need basic guided product research before committing to a paid tool.
Pricing: Completely free. No premium tiers, no upsells.
Key features:
The only completely free TikTok Shop analytics tool that provides guided worksheets
Focuses on helping you make decisions quickly rather than overwhelming you with raw data
Interactive quiz format to match sellers with the right tools
Tradeoffs:
The depth matches the price. Sellers scaling beyond initial experiments will outgrow it fast.
No historical data, no creator analytics, no ad intelligence
Think of it as a stepping stone, not a destination
8. TikTok Seller Center (Native)
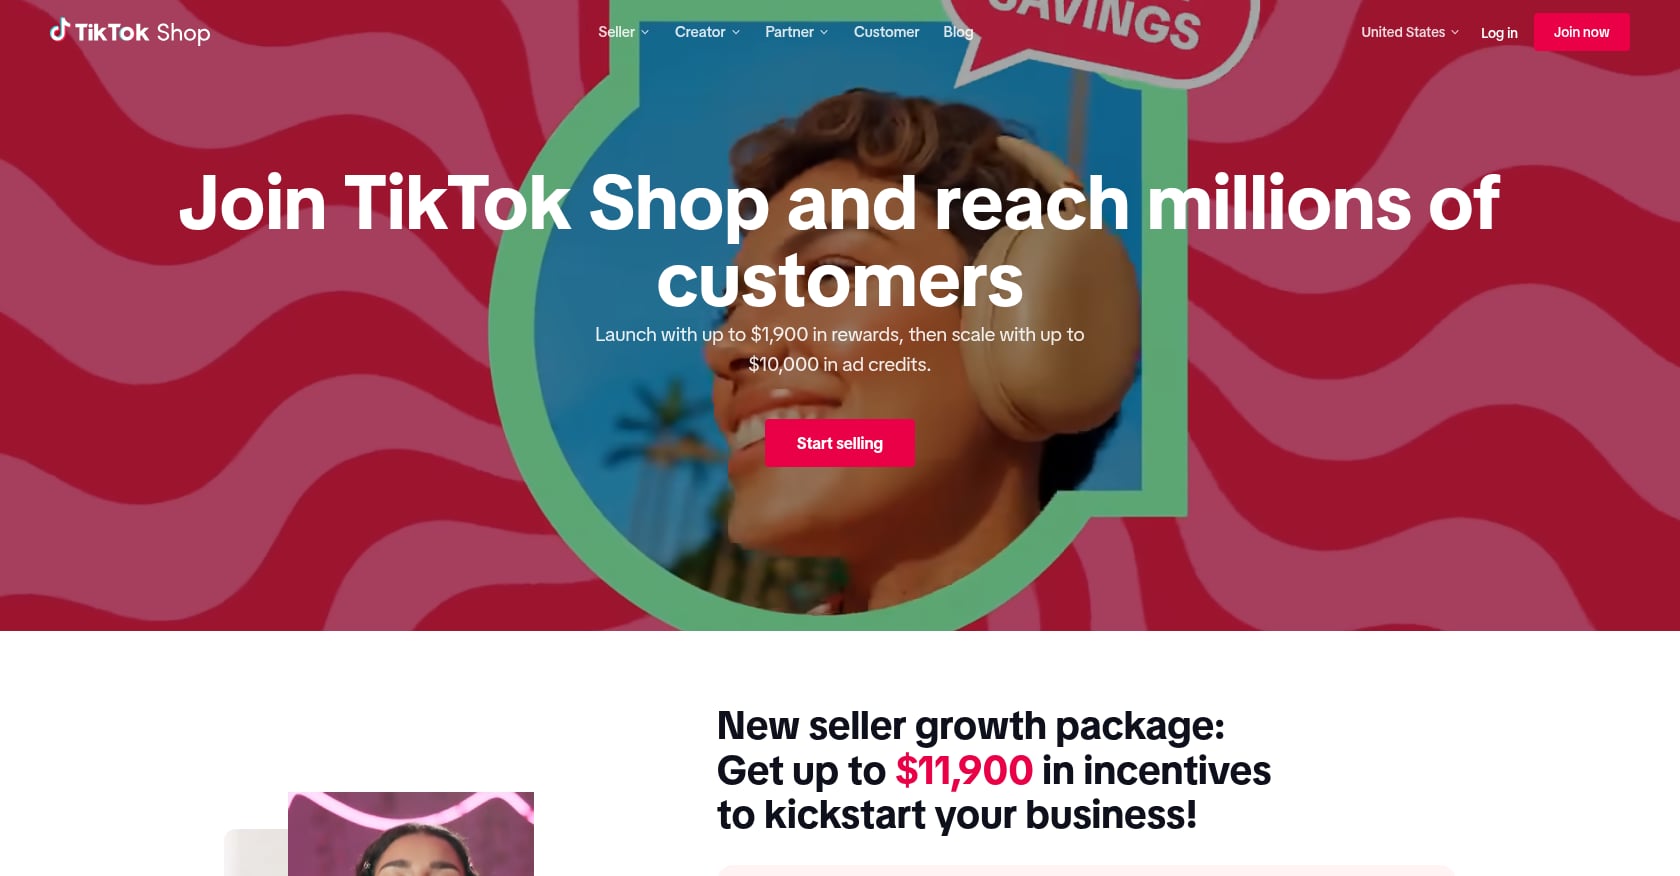
Best for: Every TikTok Shop seller, because it’s free and it’s the only source of verified first-party data about your own store.
Pricing: Free for all TikTok Shop sellers.
Key features:
Real-time GMV, order volume, and traffic data for your store
Product performance metrics
Affiliate commission tracking
Basic customer demographics
Tradeoffs:
Shows GMV, not profit. Without COGS and full fee tracking, you cannot determine actual margins.
No market intelligence. You see your own store’s data but have zero visibility into what competitors or the broader market is doing.
No content analytics tied to commerce outcomes
No historical trend data beyond your own store’s timeline
Seller Center is the floor, not the ceiling. Every tool on this list fills gaps that Seller Center leaves open.
TikTok Shop Analytics Tools Compared
Many sellers evaluate analytics platforms based on four core capabilities:
Tool | Product Research | Creator Analytics | Profit Tracking | Content Creation |
|---|---|---|---|---|
Trenz | Yes | Yes | Yes | Yes |
Kalodata | Yes | Yes | No | No |
FastMoss | Yes | Yes | No | No |
PiPiADS | Limited | Limited | No | No |
Dashboardly | No | No | Yes | No |
Shoplus | Yes | Limited | No | No |
SimpTok | Basic | No | No | No |
Seller Center | No | No | Limited | No |
The biggest difference between platforms is whether they focus on market intelligence or business profitability.
Market intelligence tools help identify trends and winning products. Profit analytics tools help determine whether sales actually generate profit after fees, refunds, commissions, and advertising costs.
A growing number of sellers now prefer unified platforms that combine both functions to reduce reporting silos.
How to Choose the Right Analytics Tool
The best TikTok Shop analytics tools for your business depend on three things: your stage, your primary pain point, and your budget.
By stage:
Just starting out: Begin with TikTok Seller Center (free) plus SimpTok (free) or Shoplus ($14.90/month). Get your first sales before investing in premium analytics.
Growing (under $10K/month GMV): You need market intelligence to find winning products. Kalodata or Trenz’s Market Analyst agent gives you structured research without guesswork.
Scaling ($10K+ monthly GMV): Profit tracking becomes critical. Add Dashboardly for P&L visibility. If content production is your bottleneck, Trenz’s Creative Director and Social Manager agents eliminate tool-switching.
Agency or multi-brand: You need multi-shop dashboards, team collaboration, and either broad market coverage (FastMoss) or a unified workflow (Trenz Scale plan with 50 social accounts).
By primary pain point:
“I don’t know what to sell” → Kalodata, FastMoss, or Trenz (Market Analyst agent)
“I’m selling but don’t know if I’m profitable” → Dashboardly
“I need to spy on competitor ads” → PiPiADS
“I want to find products, make videos, publish, and track results in one place” → Trenz
By budget:
$0: SimpTok + Seller Center + Trenz free tier (50 credits)
Under $50/month: Shoplus or Dashboardly
$50 to $100/month: Kalodata Starter or FastMoss Basic
$100+ or agency: Trenz Pro/Scale, FastMoss Premium, or Dashboardly agency tiers
For a broader look at how AI social commerce tools fit into this ecosystem, that guide covers the full landscape beyond just analytics.
The “Stack vs Suite” Question
Here’s a pattern that shows up constantly in seller communities: someone asks which analytics tool to buy, and the answers always involve combining multiple tools. “Use Kalodata for research, Dashboardly for profit, CapCut for editing, Later for scheduling.” Before you know it, you’re paying for 4 or 5 subscriptions and spending hours moving data between them.
The hidden cost isn’t just money. It’s the disconnect between insights and action. You find a trending product in Kalodata, but then you switch to a separate video tool to create content, then switch again to schedule it, then check a different dashboard to see if it drove sales. The data lives in silos. You can’t trace a line from “I discovered this product” to “this video generated $X in GMV.”
This is where the stack vs. suite decision matters.
When point tools win: If you have one specific, well-defined problem. Need SKU-level profit tracking and nothing else? Dashboardly is hard to beat at $29/month. Running $5K+/month in TikTok ads and only need creative intelligence? PiPiADS is purpose-built for that.
When a suite wins: If your bottleneck is the workflow itself. If you’re spending more time switching between tools than actually making decisions, a platform like Trenz that handles discovery, content creation, publishing, and tracking in one place eliminates that friction. The agent-based approach (Market Analyst finds the opportunity, Creative Director makes the video, Social Manager publishes it) mirrors how an actual team would work, just faster and without the communication gaps.
Neither approach is universally better. But if you’re currently paying for 3+ tools and still feel like you’re missing connections between your data, that’s a signal to evaluate a unified platform approach.
FAQs
What analytics does TikTok Seller Center provide for free?
Seller Center gives you real-time GMV, order volume, traffic sources, product performance, affiliate commission data, and basic customer demographics for your own store. It does not show profit margins, competitor data, market trends, or content-to-commerce attribution. Every seller should use it as a baseline, but it’s not sufficient for strategic decisions about what to sell or whether you’re actually profitable.
Can I use multiple TikTok Shop analytics tools together?
Yes, and many sellers do. A common combination is a market intelligence tool (like Kalodata or FastMoss) paired with a profit tracker (like Dashboardly). The tradeoff is cost and complexity. Each additional tool adds subscription fees and requires you to manually connect insights across platforms. If you find yourself using 3+ tools, consider whether an end-to-end platform could replace part of that stack.
Which TikTok Shop analytics tool is best for affiliates and creators?
Affiliates and creators need two things: product discovery (what’s converting well enough to promote) and creator analytics (which creators are driving actual sales, not just views). Kalodata is strong on creator scouting. Trenz combines product discovery with content creation tools, which is particularly useful for affiliates who need to produce videos quickly around trending products.
Is there a completely free TikTok Shop analytics tool?
SimpTok is the only fully free option with no premium tiers. Trenz offers a free plan with 50 welcome credits and no credit card required. Kalodata, FastMoss, and Shoplus offer limited free trials (3 to 14 days). TikTok Seller Center is free but only covers your own store’s data, not market intelligence.
How accurate are third-party TikTok Shop analytics tools?
Accuracy varies. Tools that pull data through official TikTok APIs (like Dashboardly, which is a verified TikTok Shop Partner) tend to be more reliable for store-specific data. Market intelligence tools like FastMoss and Shoplus have been criticized by users for inconsistent accuracy. Kalodata offers 500 days of historical data with transparent methodology. The general rule: use third-party market data for directional insights and trend identification, not as exact figures.
What’s the difference between Kalodata and FastMoss?
This is the most common comparison in TikTok seller forums. Kalodata has a cleaner interface, lower entry pricing (~$38/month vs ~$49/month), and deeper historical data (500 days). FastMoss covers more markets (9 vs Kalodata’s focus on major markets), tracks 200M+ products, and includes LIVE analytics and ad intelligence. FastMoss is better for agencies running multi-country operations. Kalodata is better for individual sellers who want simplicity. Neither tracks profit or creates content.
Do I need an analytics tool if I’m just starting on TikTok Shop?
Not immediately. Start with Seller Center and SimpTok (both free). Once you’ve made your first sales and want to scale, that’s when analytics tools start paying for themselves. The exception: if you’re entering a competitive category and need to validate product-market fit before investing in inventory, a 7-day free trial of Kalodata or Trenz’s free tier can save you from an expensive mistake.
What does “agent-based UX” mean for analytics tools?
Instead of giving you dashboards full of data and expecting you to figure out what to do, agent-based tools assign specialized AI agents to specific jobs. In Trenz’s case, a Market Analyst agent handles product discovery, a Creative Director agent handles content creation, and a Social Manager agent handles publishing and engagement. You interact with them conversationally, and they coordinate automatically. It’s a newer approach that no other TikTok Shop analytics tool currently offers.
What is the difference between TikTok Shop analytics and TikTok Ads analytics?
TikTok Shop analytics focuses on product sales, affiliate performance, customer behavior, and revenue metrics. TikTok Ads analytics focuses on advertising campaigns, cost per click, impressions, and return on ad spend.
Can TikTok Shop analytics predict winning products?
No tool can guarantee a winning product. Analytics platforms identify trends, demand signals, creator activity, and sales momentum that help reduce risk when evaluating opportunities.
How much should sellers spend on analytics software?
Most sellers spend between 1% and 5% of monthly revenue on analytics and research tools. The appropriate budget depends on store size, product catalog complexity, and advertising spend.
Do TikTok Shop analytics tools work internationally?
Most major platforms support multiple TikTok Shop regions, including the United States, United Kingdom, Southeast Asia, and selected European markets. Coverage varies by provider.
The TikTok Shop analytics space is moving fast, with tools adding features and raising prices quarter over quarter. The right choice depends on what problem is actually costing you the most: finding products, proving profit, creating content, or wasting time switching between tools.
If you want to see how a single platform handles all four, start free with Trenz and test the workflow with 50 credits, no credit card needed.
Author


